Total Size
In this example, a 1 TB disk is added to a log collector. Right from the beginning a discrepancy can be seen between the size of the disk (1 TB) and the amount of space that the operating system sees (917 GB). This discrepancy is due to a couple of factors:
- File system overhead: There is some overhead associated with creation of the file system on the disk, but it is fairly minor.
- 1000 vs. 1024 Bytes per Kilobyte: Hard drive manufacturers count 1000 bytes per kilobyte while the operating system uses 1024 bytes per kilobyte. This is the biggest source of the discrepancy that we see above. You still actually have the same number of bytes available, hard drive manufacturers just count the kilobytes differently.
Logd Formatted Logs
One third (~33%) of the available disk space is allocated to logd formatted logs. The logd format is what was used prior to the introduction of Elasticsearch. Post 8.0, the logd formatted logs are stored to support upgrade and downgrade only. No indexes are generated for these logs.
Elasticsearch
Two thirds (~66%) of the available disk space is allocated for use by Elasticsearch. Configured quotas are applied against this allocated space. In the graphic above it can be seen that the default quota percentages are applied against the 66% of the total disk space that is allocated to Elasticsearch.
Checking disk usage on the CLI
To check overall disk usage:
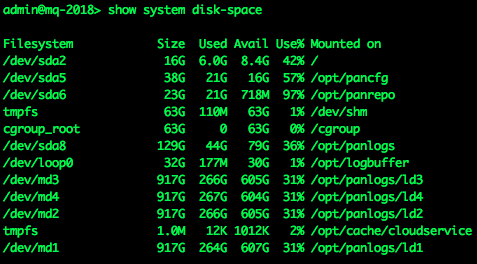
> show system disk-space
This command will show the PAN-OS equivalent to the Unix 'df -h' command. Usage statistics for each mount are included. Logging disks are mounted on /opt/panlogs/:

Looking at the 'Size' column for the logging disks shows that the operating system sees the disks as 917 GB due to the 1000 vs 1024 bytes per kilobyte discrepancy.
To check usage by Elasticsearch
> show system search-engine-quota
This command will show the status of Elasticsearch's disk allocation (66% of total disk size):

To check usage by logd
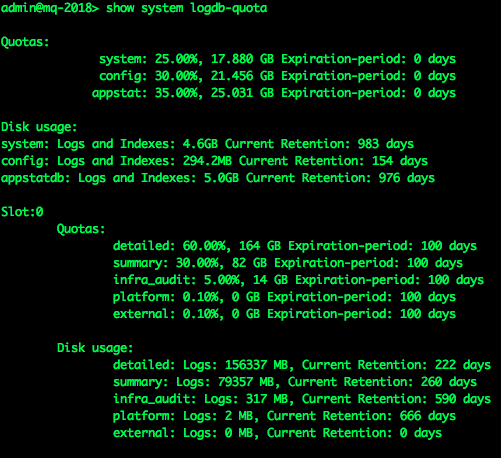
> show system logdb-quota
This command will show the space used for storing logdb formatted logs (33% of total disk size):
