You can check global counters for a specific source and destination IP addresses by setting a packet filter. We recommend that you use the global counter command with a packet filter to get specific traffic outputs. These outputs will help isolate the issue between two peers.
Steps
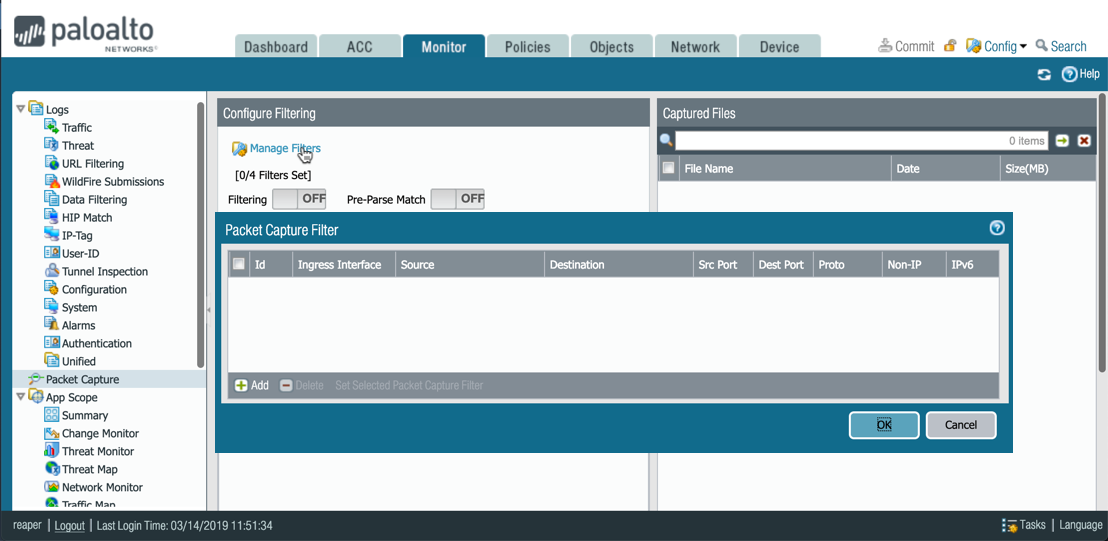
- Go to Monitor > Packet Capture and click "Manage Filter," as shown below:

- You have two options to set the packet filter.
Option 1: Set the packet filter for a specific source and destination traffic.

Option 2: Set the packet filter for a specific source to all destination traffic. All fields left blank will auto-fill to 0.0.0.0 (everything).

Note: If needed, port details and protocol information is available to retrieve specific outputs regarding the traffic. Also, please delete or clear the filter every time you set a new filter.
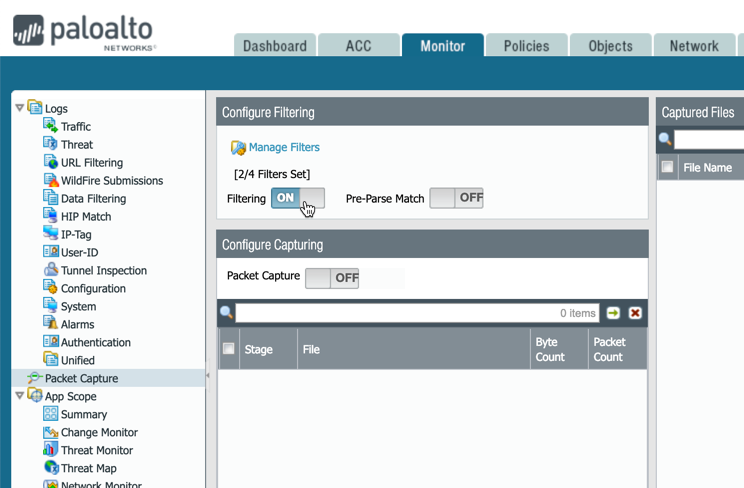
- Switch ON the packet filter, as shown below. Note: Leave the "Packet Capturing" option OFF.

- Use the following CLI command to show when traffic is passing through the Palo Alto Networks firewall from that source to destination.
> show counter global filter packet-filter yes delta yes
Global counters:
Elapsed time since last sampling: 20.220 seconds
name value rate severity category aspect description
--------------------------------------------------------------------------------
pkt_recv 6387398 4 info packet pktproc Packets received
pkt_recv_zero 370391 0 info packet pktproc Packets received from QoS 0
pkt_sent 6017192 4 info packet pktproc Packets transmitted
pkt_alloc 20230 0 info packet resource Packets allocated
session_allocated 4677 0 info session resource Sessions allocated
session_freed 4677 0 info session resource Sessions freed
session_installed 4639 0 info session resource Sessions installed
flow_rcv_err 75268 0 drop flow parse Packets dropped: flow stage receive error
flow_rcv_dot1q_tag_err 28498 0 drop flow parse Packets dropped: 802.1q tag not configured
flow_no_interface 28498 0 drop flow parse Packets dropped: invalid interface
flow_ipv6_disabled 13036 0 drop flow parse Packets dropped: IPv6 disabled on interface
flow_np_pkt_rcv 3415289 2 info flow offload Packets received from offload processor
flow_np_pkt_xmt 2951740 2 info flow offload Packets transmitted to offload processor
flow_fwd_l3_mcast_drop 11990 0 drop flow forward Packets dropped: no route for IP multicast
flow_fwd_l3_noarp 22 0 drop flow forward Packets dropped: no ARP
flow_arp_pkt_rcv 134419 0 info flow arp ARP packets received
flow_arp_pkt_xmt 37 0 info flow arp ARP packets transmitted
flow_arp_pkt_replied 258 0 info flow arp ARP requests replied
flow_arp_pkt_learned 28 0 info flow arp ARP entry learned
flow_arp_rcv_gratuitous 4247 0 info flow arp Gratuitous ARP packets received
flow_arp_rcv_err 77 0 drop flow arp ARP receive error
flow_arp_resolve_xmt 13 0 info flow arp ARP resolution packets transmitted
flow_mld_pkt_rcv 3 0 info flow mld MLD packets received
flow_mld_pkt_xmt 5 0 info flow mld MLD packets transmitted
flow_host_pkt_rcv 2951945 2 info flow mgmt Packets received from control plane
flow_host_pkt_xmt 3065452 2 info flow mgmt Packets transmitted to control plane
flow_host_decap_err 308 0 drop flow mgmt Packets dropped: decapsulation error from control plane
flow_host_service_allow 20534 0 info flow mgmt Device management session allowed
flow_host_service_deny 18051 0 drop flow mgmt Device management session denied
flow_host_ha_decap_err 4 0 drop flow mgmt Packets dropped: decapsulation error from control plane's HA agent
flow_lion_rcv_err 75241 0 drop flow offload Packets dropped: receive error from offload processor
flow_lion_flow_insert 9278 0 info flow offload Lion flow insert transactions
flow_lion_flow_delete 9270 0 info flow offload Lion flow delete transactions
flow_lion_flow_delete_err 8 0 error flow offload Lion flow delete errors
flow_lion_flow_update 14578 0 info flow offload Lion flow update transaction
flow_lion_rcv_ha 3044898 2 info flow offload Lion packets received from ha queue
flow_lion_rcv_fastpath 20329 0 info flow offload Lion packets received from fastpath queue
flow_lion_rcv_slowpath 274821 0 info flow offload Lion packets received from slowpath queue
appid_ident_by_dport_first 65 0 info appid pktproc Application identified by L4 dport first
appid_proc 3096 0 info appid pktproc The number of packets processed by Application identification
appid_use_dfa_1 3090 0 info appid pktproc The number of packets using the second DFA table
appid_unknown_fini_empty 1478 0 info appid pktproc The number of unknown applications because of no data
dfa_sw 6 0 info dfa pktproc The total number of dfa match using software
dfa_sw_min_threshold 6 0 info dfa offload Usage of software dfa caused by packet length min threshold
dfa_fpga 12664 0 info dfa offload The total requests to FPGA for dfa
dfa_fpga_data 2090014 0 info dfa offload The total data size to FPGA for dfa
ctd_sml_exit_detector_i 1030 0 info ctd pktproc The number of sessions with sml exit in detector i
ctd_handle_reset_and_url_exit 1030 0 info ctd pktproc Handle reset and url exit
ctd_err_bypass 1030 0 info ctd pktproc ctd error bypass
ctd_sml_vm_check_domain 90 0 info ctd pktproc sml vm check domain
ctd_bloom_filter_nohit 180 0 info ctd pktproc The number of no match for virus bloom filter
aho_fpga 7500 0 info aho resource The total requests to FPGA for AHO
aho_fpga_data 1806498 0 info aho resource The total data size to FPGA for AHO
aho_sw_min_threshold 2074 0 info aho pktproc Usage of software AHO caused by packet length min threshold
aho_sw 2074 0 info aho pktproc The total usage of software for AHO
ctd_appid_reassign 1030 0 info ctd pktproc appid was changed
ctd_pkt_slowpath 11838 0 info ctd pktproc Packets processed by slowpath
log_uid_req_cnt 1 0 info log system Number of uid request logs
log_pkt_diag_us 149 0 info log system Time (us) spend on writing packet-diag logs
url_db_reply 19 0 info url pktproc Number of URL reply
ssl_hsm_up_down_event_rcv 1 0 info ssl pktproc The number of HSM up/down events received
pkt_flow_mgmt 1 0 info packet resource Packets entered module flow stage mgmt
pkt_flow_ctrl 1 0 info packet resource Packets entered module flow stage ctrl
pkt_nac_result 20164 0 info packet resource Packets entered module nac stage result
pkt_flow_np 3415289 2 info packet resource Packets entered module flow stage np
pkt_module_internal 1 0 info packet resource Packets entered module module stage internal
pkt_pktlog_forwarding 1 0 info packet resource Packets entered module pktlog stage forwarding
pkt_flow_host 2951945 2 info packet resource Packets entered module flow stage host
--------------------------------------------------------------------------------
Total counters shown: 68
--------------------------------------------------------------------------------
- To get counters just for dropped packets, because the output might be too great, use this CLI command:
> show counter global filter packet-filter yes delta yes severity drop
Global counters:
Elapsed time since last sampling: 139.639 seconds
name value rate severity category aspect description
--------------------------------------------------------------------------------
flow_rcv_err 75268 0 drop flow parse Packets dropped: flow stage receive error
flow_rcv_dot1q_tag_err 28498 0 drop flow parse Packets dropped: 802.1q tag not configured
flow_no_interface 28498 0 drop flow parse Packets dropped: invalid interface
flow_ipv6_disabled 13036 0 drop flow parse Packets dropped: IPv6 disabled on interface
flow_fwd_l3_mcast_drop 11990 0 drop flow forward Packets dropped: no route for IP multicast
flow_fwd_l3_noarp 22 0 drop flow forward Packets dropped: no ARP
flow_arp_rcv_err 77 0 drop flow arp ARP receive error
flow_host_decap_err 308 0 drop flow mgmt Packets dropped: decapsulation error from control plane
flow_host_service_deny 18051 0 drop flow mgmt Device management session denied
flow_host_ha_decap_err 4 0 drop flow mgmt Packets dropped: decapsulation error from control plane's HA agent
flow_lion_rcv_err 75241 0 drop flow offload Packets dropped: receive error from offload processor
--------------------------------------------------------------------------------
Total counters shown: 11
--------------------------------------------------------------------------------
See Also
owner: sbabu


