Salesforce

High on-chip descriptor and packet buffer usage due to policy deny resulting in traffic latency and drops

« Go Back

Information

 
TitleHigh on-chip descriptor and packet buffer usage due to policy deny resulting in traffic latency and drops
URL NameHigh-on-chip-descriptor-and-packet-buffer-usage-due-to-policy-deny-resulting-in-traffic-latency-and-drops
SummaryTraffic latency or packet drops due to high on-chip descriptor usage and a noticeable increase in flow_policy_deny global counters.
Validation StatusValidated - External
Publication StatusPublished
Symptom
  • Latency/slowness observed, in some cases packet loss for traffic traversing through the Firewall.
  • Usually the DataPlane (DP) CPU usage remains within the expected range and no huge deviation from the usual or "working condition".
  • Spike in flow_policy_deny global counters.
  • The top session in show running resource-monitor ingress-backlogs has flow_slowpath

Note : Group IDs could be other than 16. Refer additional information section for more details. 
Example:

> show running resource-monitor ingress-backlogs 
<snip>
-- SLOT: s1, DP: dp0 --
USAGE - ATOMIC: 88% TOTAL: 89%

TOP SESSIONS:
SESS-ID         PCT     GRP-ID  COUNT
2022536315      88%     flow_slowpath      3640

<snip>


  • show session id shows "Bad Key", and its consumption is taking a majority % of on-chip.

Example:

> show session id 2022536315

Session      2022536315

            Bad Key: c2s: 'c2s'
            Bad Key: s2c: 's2c'
        index(local):                        : 9270395


​​​​

  • Spike in on-chip packet descriptor and packet buffer usage, Example (from a live debug output):
> show running resource-monitor second last 5

DP s1dp0:

Resource monitoring sampling data (per second):

CPU load sampling by group:
flow_lookup                    :     3%
flow_fastpath                  :     3%
flow_slowpath                  :     3%
flow_forwarding                :     3%
flow_mgmt                      :     0%
flow_ctrl                      :     3%
nac_result                     :     3%
flow_np                        :     3%
dfa_result                     :     3%
module_internal                :     3%
aho_result                     :     3%
zip_result                     :     3%
pktlog_forwarding              :     9%
lwm                            :     0%
flow_host                      :     3%

CPU load (%) during last 5 seconds:
core   0   1   2   3   4   5   6   7   8   9  10  11  12  13  14  15
       *   0   3   2   2   3   3   3   4   4   2   3   2   3   3   2
       *   0   3   2   2   3   3   3   3   4   2   3   2   3   3   2
       *   0   3   3   2   4   4   3   3   3   2   2   2   3   3   3
       *   0   3   2   2   3   4   3   3   3   2   3   2   3   4   2
       *   0   3   3   2   3   3   3   3   3   2   2   2   3   4   2
core  16  17  18  19  20  21  22  23  24  25  26  27  28  29  30  31
       2   2   2   2   2   3   3   3   3   3   3   3   3   3   3   3
       2   2   2   2   2   3   3   3   3   3   3   3   3   3   3   3
       2   3   2   2   2   3   3   3   2   4   3   3   2   3   3   2
       2   3   2   2   2   3   2   3   2   3   3   3   2   3   3   3
       2   2   2   2   2   2   2   3   3   3   3   3   3   3   3   3
core  32  33  34  35  36  37  38  39  40  41  42  43  44  45  46  47
       3   2   2   2   2   2   3   2   2   2   2   2   3   2   4   9
       3   2   2   2   2   2   2   2   2   2   2   2   3   2   4   9
       3   2   2   3   2   2   2   2   2   2   2   2   3   2   4   9
       3   2   2   2   3   2   2   2   2   2   2   2   3   2   4   9
       3   2   3   2   2   2   3   2   2   2   2   2   3   2   4   9

Resource utilization (%) during last 5 seconds:
session:
  0   0   0   0   0 
packet buffer:
 14  13  13  13  12 
packet descriptor:
  0   0   0   0   0 
packet descriptor (on-chip):
100 100 100 100 100
<snip>


Environment
  • PAN-OS
  • Zone Protection
  • DOS Protection
Cause

NOTE:
High on-chip descriptor and packet buffer usage can occur under various conditions.
This article covers a specific case   of slowpath policy deny, that results in high on-chip descriptors and packet buffers.


Please note that this article applies only if the following conditions are met:

1. The top session in show running resource-monitor ingress-backlogs has flow_slowpath (pre-10.2 shows grp id 2 or grp id 16 depending on platform)
More information about grp id in "Additional Information" section

Example:

> show running resource-monitor ingress-backlogs 
<snip>
-- SLOT: s1, DP: dp0 --
USAGE - ATOMIC: 88% TOTAL: 89%

TOP SESSIONS:
SESS-ID         PCT     GRP-ID  COUNT
2022536315      88%     flow_slowpath      3640

<snip>


2.  There is Spike in flow_policy_deny global counters.
3. show session id <id> of the session obtained from ingress-backlogs, shows "Bad Key"
Example:

> show session id 2022536315

Session      2022536315

            Bad Key: c2s: 'c2s'
            Bad Key: s2c: 's2c'
        index(local):                        : 9270395

Note: In most cases, it is same 6 tuples UDP syslog traffic, that causes the issue.
UDP syslog traffic is usually high volume and uses the same source-port (socket).


4. The denied traffic has the same 6 tuples (source/destination IP, source/destination port, protocol (L3 header), ingress zone) ​​.


What's slowpath?

  • It's a set of process run for a packet which has no matching session on NGFW. If there is a matching session, the packet goes through fastpath processing on the contrary.
  • In slowpath, dataplane processors run a sequence of lookups whether the tupple should create a new session(allowed) or dropped. It means various policy lookups(DoS/QoS/NAT/Security) are run as a part of it.
    • its lookup processing can take a greater number of processing cycles like holding CPU/packet descriptor longer.
    • Especially for security policy lookup, it tends to be a big/complicated configuration.
    • The number of policies/objects/ country object /Negate option may contribute complexity of the policy in general

When/Why does policy deny cause spike/high on-chip descriptor usage?

  • If an incoming packet does not match an existing session it is subjected to slowpath.
  • If the packet matches a deny policy in slowpath ,the packet is dropped, but a session is not installed. (Deny log is generated if session logging enabled for the denying policy)
  • The next packet with the same 6 tuples would go through the same CPU-intensive slowpath (see 3rd bullet in 'what's slowpath?' section) and examined in sequence (not in parallel)
    • All the packets with the same 6 tuples are subjected to ATOMIC or serial packet processing in the incoming order (one-at-a-time).
    • As these packets have to be serially processed, they can not be sent to different cores or threads for parallel processing.
    • As the result, the packets are waiting to be processed by the DP CPU, depending on the incoming rate of packets and time taken to complete slowpath for each packet, there can be accumulation of packets.
  • If there is a significant rate/amount of such same 6 tuples traffic hitting the Firewall, getting denied on slowpath, the on-chip descriptors and eventually the packet buffers can get filled up.
  • At this point you would start to see traffic issues. (slowness/packet drop)

For more information refer to the "Additional Information" section.

Resolution

NOTE

  • Once you have determined that the policy deny is significantly high or is higher than usual, the next step is to Identify the source of this Traffic.

Note: In most cases, it is same 6 tuples UDP syslog traffic, that causes the issue.
UDP syslog traffic is usually high volume and uses the same source-port (socket).

How to identify the offender

  • Run "show running resource-monitor ingress-backlogs", find high usage on flow_slowpath.this is an evidence of the issue. but unfortunately clue of IP/tupple is not shown for this slowpath issue.
  • Find related Deny traffic log . Catch-all policy may have numerous deny log for the specific tupple
    • As all tupple is shown in the log, this is an ideal way to know a nature of traffic. (can identify/assume source/dst/application, etc)
    • If not seen, make sure catch-all / other deny policies are logged
    • Policy hit count for each policies can be a clue to determine which policy is denying the packets. The policy may need to enable deny traffic log to capture the tupple
  • Run "show session packet-buffer-protection". it shows packet buffer protection detecting information that can show source/dst IP
    • In threat log, filter PBP events, it show a clue of  source IP or souce and destIP,too. (search with "PBP" in threat log filter)
  • Drop stage pcap or external pcap
    • You can enable drop stage pcap with packet-count option (with a specific tupple filter at your best). packet-count option helps to disable pcap automatically after capturing a specified number of packets. (all other drop packets are included. but you should be able to assume which is the abuser as the rate of drop is high)
    • External pcap in customer network is also helpful
  • ACC is not useful to identify the attacker as deny traffic log(packet/byte count=0) is not included in the report.


Mitigation

In customer network side,
1.
Once the source of the denied traffic is identified, check if it is feasible to stop this traffic at source or closer to source.

i.e.

  • Stop the traffic from the source
    • Example: If there is a device that is flooding syslog messages to a particular destination, you can remove the syslog server destination from that device to stop the flood.
  • Discard the traffic with ACL on a network device before reaching the NGFW
  • Discard unnecessary traffic with static route to null interface
    • In one of typical cases, in case customer's core switch pointing NGFW (i.e. when segregating trust/untrust zone) for default route, for packets can't be resolvable in core switch's routing table can be forwarded to the NGFW.  Eliminating such unnecessary traffic reaching NGFW could be ideal solution.

On NGFW,
2. Allowing traffic with security policies 

  • Before moving into mitigation techniques, we should make sure the traffic causing the issue is supposed to be denied or allowed.
  • If the traffic needs to be allowed, create the required security policy. Once the traffic is allowed, a session would be installed and the traffic is no longer subjected to slowpath.
  • If an impacting traffic pattern is not known yet, a security policy can be created to allow high volume traffic like syslog from internal/trusted zones(apply security profiles as required) for a try, to see packet descriptor usage goes down or not.

3. Protection against known offenders (DoS policy deny)

  • If exact IPs of the hosts causing the issue are known, creating a DoS policy with the action “Deny” will help.
  • Try DoS policy rules as specific as possible (source/destination zone, IPs, service port)
  • Since DoS policies are evaluated before security policy lookup and do not have large number of entries, packets are blocked earlier thereby greatly saving firewall resources. 
  • This step is helpful to make sure the specified tupple(s) in DoS policy is really the abuser as an interim step. Once the traffic pattern is confirmed, next step (DoS policy protect) can be considered to apply with more tuned configuration 

4. Protection against unknown offenders (DoS policy protect)

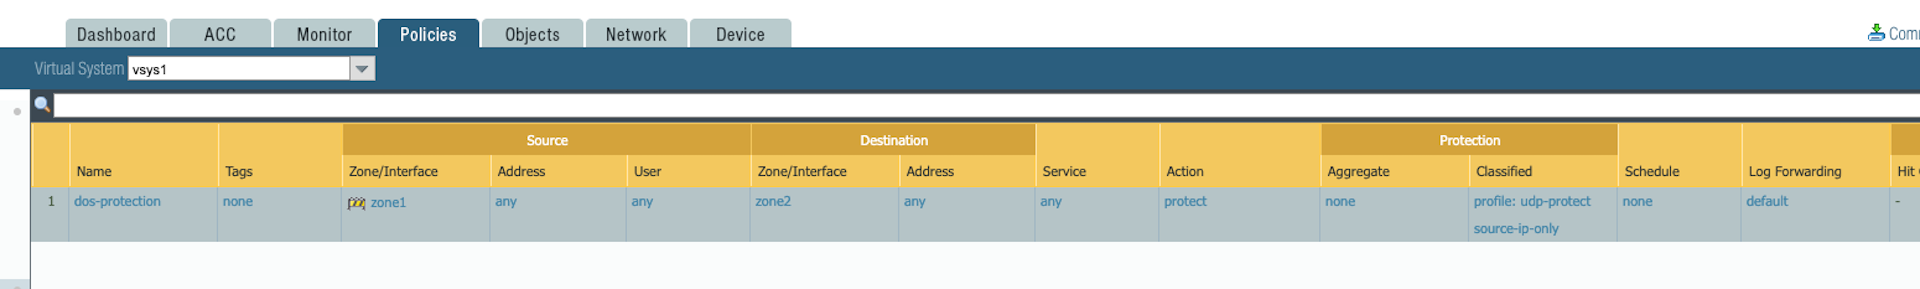
  • Creating a DoS classified policy with the action “Protect” 
  • A classified DoS policy can be applied with action “Protect” and address matched to “source-ip only” or “src-dest-ip-both”.

User-added image
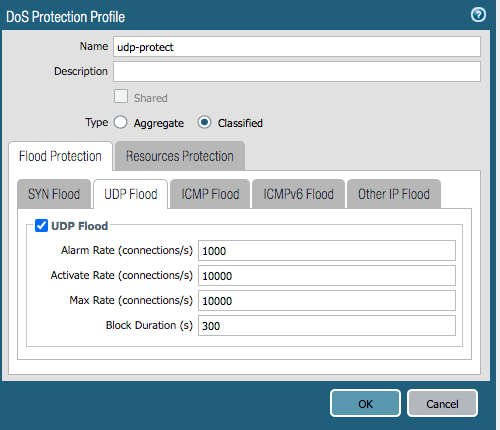
***Note:  Configured threshold values are only examples, these need to be tweaked based on customer environment

User-added image

  • Once the configured threshold is reached, the DoS policy would create a DoS ip-block-table, which would start dropping packets without being subjected to slowpath.
  • In devices that have an offload processor, the block table would be installed in the offload hardware to further reduce the load on the DP CPU.
  • For further reading refer : Monitor Block List and DoS Protection Profiles and Policy Rules

 Caveat:

  • Thresholds for the classified DoS object would change based on customer traffic pattern and network, the default values may not be applicable to all environments.
  • For slowpath deny attacks only  “source-ip only” or “src-dest-ip-both” would work, using "destination-ip only" does not help.
  • For internet facing zones, since source ips could be potentially huge, the firewall doesn’t have the capacity to store counters for every possible IP address on the internet.
  • Refer: Classified vs Aggregate DoS profiles

5.  Packet Buffer Protection (PBP) 

  • Packet Buffer Protection (PBP) is a feature available starting with PAN-OS 8.0.
  • PBP is preferred, as it is automatic and is triggered based on actual resource utilization, when compared to DoS policy which is triggered on pre-configured connections per second threshold
  • PBP protects the firewall both from slowpath and fastpath (existing session) buffer depletion.
  • Firewall monitors buffer abusers automatically.
  • After reaching the configured activate threshold (default 50%), the firewall starts dropping offending traffic (RED).
  • If buffer utilization is above 80% ( this threshold is internally hardcoded and not configurable) for a duration of block hold time a dos block table entry is created.
  • Refer: Packet Buffer Protection

In this specific case of slowpath deny usually a combination of PBP + DoS classified policy with the action “Protect” provides better results.

Monitoring:

SNMP can be leveraged to monitor buffer utilization among other things. DP resources are part of  HOST-RESOURCES-MIB. More information can be found here: 
SNMP for Monitoring Palo Alto Networks Devices
snmp-mibs

List of useful OIDs:
1. Description - .1.3.6.1.2.1.25.2.3.1.3.xxxx
Example:
.1.3.6.1.2.1.25.2.3.1.3.1011 = STRING: "Slot-1 Data Processor-0 Hardware Packet Buffers"
.1.3.6.1.2.1.25.2.3.1.3.1111 = STRING: "Slot-1 Data Processor-1 Hardware Packet Buffers"

2.  Hardware Packet Buffer pool size - .1.3.6.1.2.1.25.2.3.1.5.xxxx
Example:
.1.3.6.1.2.1.25.2.3.1.5.1011 = INTEGER: 17203 
.1.3.6.1.2.1.25.2.3.1.5.1111 = INTEGER: 17203

3. Current Buffer Utilization - .1.3.6.1.2.1.25.2.3.1.6.xxxx
Example:
.1.3.6.1.2.1.25.2.3.1.6.1011 = INTEGER: 122 
.1.3.6.1.2.1.25.2.3.1.6.1111 = INTEGER: 128 
 

DoS related counters via SNMP (part of PAN-COMMON-MIB): 
 

MIB IdentityCounter DescriptionOID
panFlowPolicyDenyflow_policy_denySession setup: denied by policy.1.3.6.1.4.1.25461.2.1.2.1.19.8.10
panFlowDosBlkNumEntriesflow_dos_blk_num_entriesNumber of entries in DOS block table.1.3.6.1.4.1.25461.2.1.2.1.19.8.2
 
panFlowDosBlkSwEntriesflow_dos_blk_sw_entriesNumber of entries in DOS Software block table.1.3.6.1.4.1.25461.2.1.2.1.19.8.33
panFlowDosBlkHwEntries flow_dos_blk_hw_entries Number of entries in DOS Hardware block table.1.3.6.1.4.1.25461.2.1.2.1.19.8.34
panFlowDosDropIpBlocked flow_dos_drop_ip_blockedPackets dropped: Flagged for blocking and under block duration by  DoS or other modules.1.3.6.1.4.1.25461.2.1.2.1.19.8.13
panFlowDosRuleDrop flow_dos_rule_drop Packets dropped: Rate limited or IP blocked.1.3.6.1.4.1.25461.2.1.2.1.19.8.23


Additional Information


Why do we see 'Bad Key' when running show session id <id> of the session obtained from ingress-backlogs?
Since at this stage the session is not yet installed, the value under SESS-ID is an internal tag value and not the actual session id.
In this specifc case of slowpath deny, if you carefully look at the valued under SESS-ID, the value is much higher than the session index range. (Which by itself is a clue. that it is nota session id)
Hence when you use the show session id <idx> since the value is not an actual session id you see 'Bad Key'.

Why do we need ATOMIC or serial packet processing (on-at-a-time)?

  • Each packet processing stage has different requirements in terms of whether it should be subjected to serial packet processing (one-at-a-time in the incoming order) or parallel packet processing for a given 6 tuple/session.
  • The goal of serial packet processing is to avoid multiple cores/threads performing the same operation or accessing/writing on the same data. 
  • For instance, if we receive a burst of new traffic that should belong to the same session, we don’t want multiple cores/threads to perform session installation, hence we don't process the packets in parallel but subject them to serial processing.

Why is the DP CPU low, but the on-chip descriptor and packet buffer usage is high?

  • As explained earlier, since the same 6 tuples deny traffic is subjected to serial processing, it is possible that most of the cores are just waiting for work/packets to be processed.
  • Hence the CPU usage would be low, but the packet buffer and on-chip descriptor resources could fill up.

When would show running resource-monitor ingress-backlogs display grp id 2 and when would it display grp id 16?

  • Each group viz. flow_fastpath, flow_slowpath etc, is assigned a group id (grp id)
  • grp id 2 and 16 both stand for slowpath/ flow_slowpath
  • On older hardware models (Ex: PA-3000, PA-5000 etc) and in case of PA-7000 series older NPC models you would see grp id 2
  • On newer hardware models (Ex: PA-5200, PA-3200)  and in case of PA-7000 series newer NPC models you would see grp id 16 or grp id 17 or grp id 18 etc.
  • Please note that the grp id values can also be 17 or 18, but still stand for Slowpath.
  • This is because on Newer Platforms to get the actual grp id a right shift of 3 bits is needed. 
  • For values like 16,17,18 etc, they all will result in the value of 2 after right shift of 3 bits is done. 
  • So any grp id that results in the value of 2 after a 3 Bit right shift will represent slowpath/flow_slowpath.
  • PSE-309 (from PanOS 10.2) has an enhancement to convert them to flow_slowpath regardless of platform


Legacy ID
Legacy Url
Auto Assistant Signature

Powered by