Symptom
Alarms are generated as per the configuration. One such alarm is 'Database traffic exceeds percentage limit. Limit set to <value> MB.'
To view the set quotas, run the following command via the CLI:
admin@pa-500(active)> show system logdb-quota

Quotas:
traffic: 32.00%, 38.123 GB
threat: 16.00%, 19.061 GB
system: 4.00%, 4.765 GB
config: 4.00%, 4.765 GB
alarm: 3.00%, 3.574 GB
trsum: 12.00%, 14.296 GB
thsum: 4.00%, 4.765 GB
appstat: 12.00%, 14.296 GB
application-pcaps: 1.00%, 1.191 GB
threat-pcaps: 1.00%, 1.191 GB
debug-filter-pcaps: 1.00%, 1.191 GB
dlp-logs: 1.00%, 1.191 GB
Disk usage:
traffic: Logs: 32G, Index: 6.9G
threat: Logs: 1.4G, Index: 276M
system: Logs: 41M, Index: 15M
config: Logs: 3.3M, Index: 2.1M
alarm: Logs: 256K, Index: 96K
trsum: Logs: 8.7G, Index: 1.4G
thsum: Logs: 5.7M, Index: 2.3M
appstatdb: Logs: 12M, Index: 5.8M
application-pcaps: 44M
threat-pcaps: 587M
debug-filter-pcaps: 281M
dlp-logs: 9.8M
From the information above:
- Traffic Disk Quota set = 32.00%, 38.123 GB
- Traffic DB Disk Usage = ogs: 32G, Index: 6.9G -> total 38.9GB
- Traffic Alarm Threshold set to 90% ( of 38.123 ) = 34.3107
The traffic database alarms are generated if the size of the traffic database (after purge, if any) exceeds 34.3107 GB.
The size of traffic (not displayed in the alarm message) must be > 34.3107 GB after log purging.
The limit value displayed in the alarm is the disk quota set for the database.
Resolution
To resolve the alarm message:
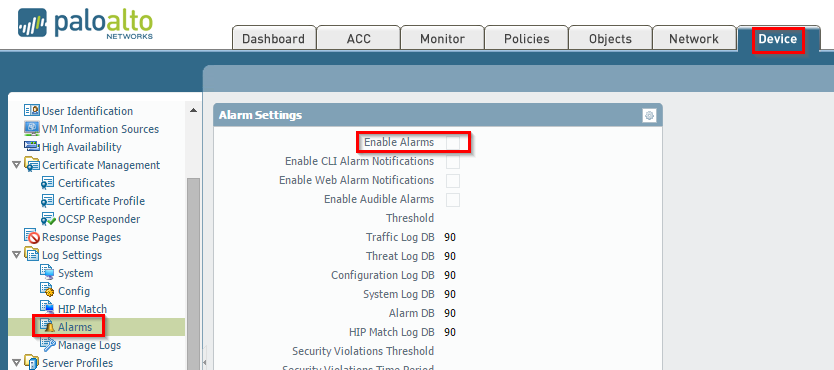
- Turn off the alarm logs in the WebGUI under Device > Log Settings > Alarms and uncheck Enable Alarms.

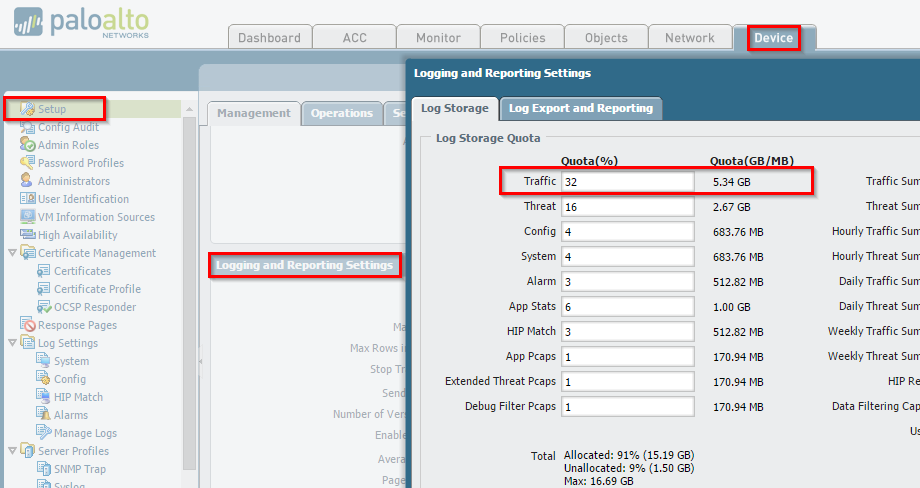
- The other option is to change the log storage size under Device > Setup > Management.

owner: mrajdev