This Tips & Tricks looks at the Application Command Center, (ACC), which provides visibility into the network traffic passing through your firewall. The ACC is sometimes overlooked inside the WebGUI, but it is a very powerful tool to help you manage and see the traffic flowing through your network.
In order to learn more about the ACC, we'll explore the following areas:
- What is the Application Command Center (ACC)?
- Parts of the Application Command Center (ACC) and how to get more information from the ACC
What is the Application Command Center (ACC)?
The Application Command Center (ACC) page visually depicts trends and a historic view of traffic on your network. It displays the overall risk level for all network traffic, the risk levels and number of threats detected for the most active and highest-risk applications on your network, and the number of threats detected from the busiest application categories and from all applications at each risk level. The ACC can be viewed for the past hour, day, week, month, or any custom-defined time frame.
Risk levels (1=lowest to 5=highest) indicate the application’s relative security risk, based on criteria such as whether the application can share files, is prone to misuse, or tries to evade firewalls.
Parts of the Application Command Center (ACC) and how to get more information from the ACC
We will start with the Dashboard tab:
ACC Risk Factor
Inside the WebGUI, on the Dashboard tab, you'll see ACC Risk Factor.
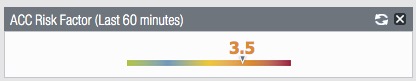
This information shows the risk factor over the last 60 minutes based upon information inside the ACC tab.
This is a general 'threat temperature' of the traffic. If you find it higher than normal, then you can use the main ACC to drill down and investigate what is causing the temperature to be higher than normal.
If you'd like to see this, and it is not being displayed on your Dashboard page, enable it from the Dashboard > Widgets > Application > ACC Risk Factor.
Top Applications
You also will see the 'Top Applications' if you have enabled this widget.
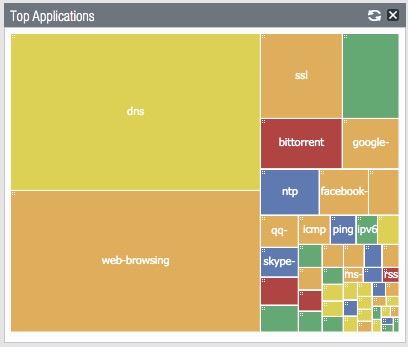
This widget displays the applications with the most sessions. The block size indicates the relative number of sessions (mouse-over the block to view the number), and the color indicates the security risk—from green (lowest) to red (highest). Click an application to view its application information, as well as a full breakdown where that application has been seen inside the ACC page.
This is a great way to see the applications in use at a glance.
If you would like to see this, it can be enabled from the Dashboard > Widgets > Application > Top Applications.

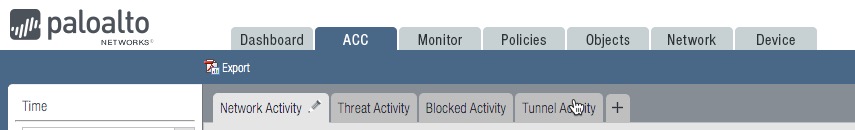
Now let's move on to the ACC tab:
On the ACC tab, you will see the following sections that make up the Application Command Center:
- Tabs
- Widgets
- Time
- Global Filters
- Application View
- Risk Meter
1. Tabs
The ACC includes predefined tabs that provide visibility into network traffic, threat activity, blocked activity, tunnel activity,...
2. Widgets
Each tab includes a default set of widgets that best represent the events and trends associated with the tab.
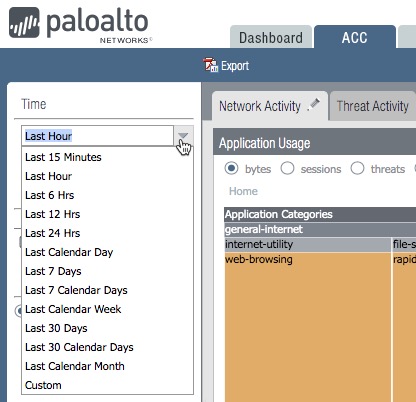
3. Time
You have options for the time that range from the last 15 minutes until the Last Calendar Month and even a Custom option. The default is Last Hour.
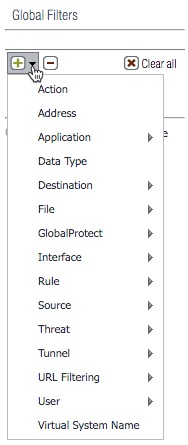
4. Global FiltersAdding a filter comes in handy if you are looking for specific traffic.
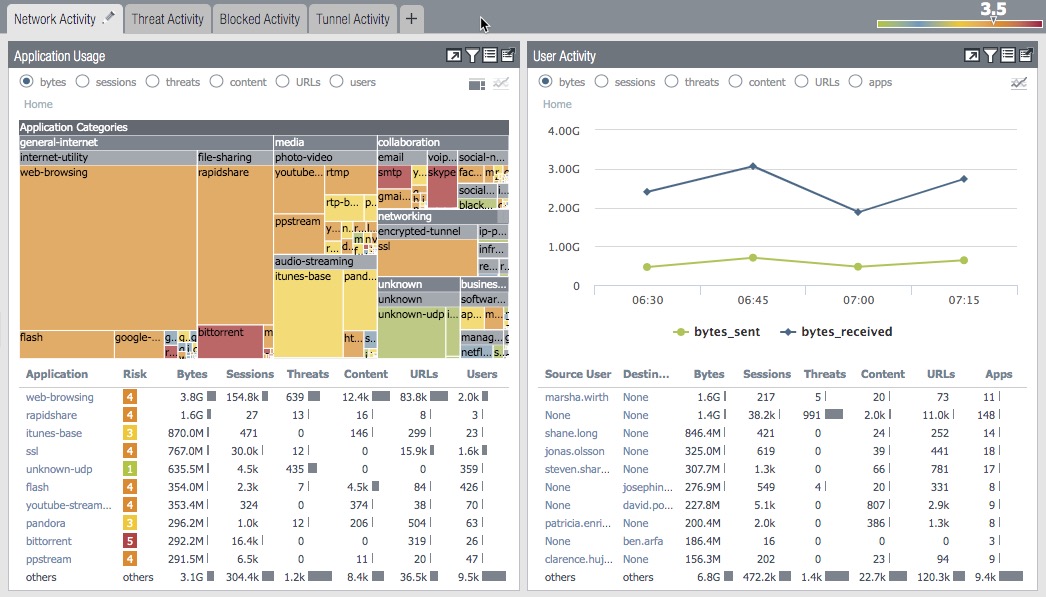
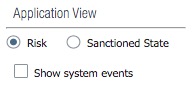
 5. Application View
The application view allows you to filter the ACC view by either the sanctioned or unsanctioned applications in use on your network.
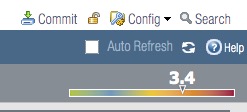
 6. Risk Meter
You'll find the same Risk Meter that you'll find on the Dashboard discussed earlier.
ACC WidgetsThe widgets on each tab are interactive. The view will change if you set a timeframe, set filters and drill down into the display to customize the view and focus on the information you need.
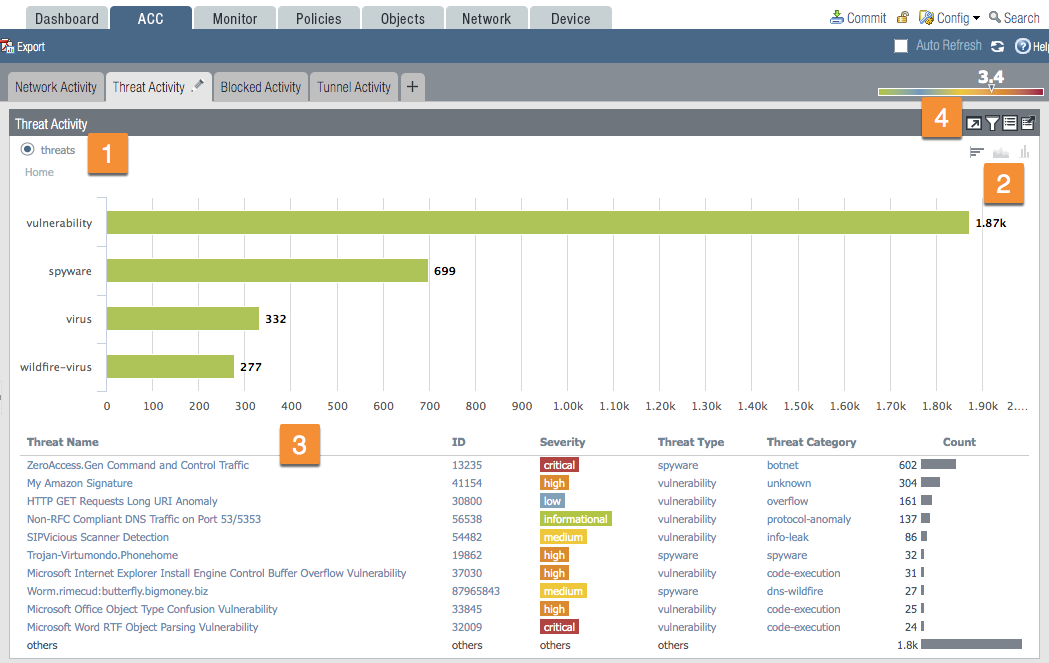
Each widget is structured to display the following information:
1. View - You can sort the data by selecting the different radio buttons
2. Graph - There are different graphical display options available depending on which widget you're on.
3. Table - A detailed view of the data used to render the graphical display.
4. Actions - Maximize view ; Set up local filters ; Jump to logs ; Export.
I hope this Tips & Tricks article has helped you understand the Application Command Center better, as well as provide you with some insight into better ways to access and use the information in the ACC.