Platform Restrictions
The information in this article is not applicable to the Palo Alto Networks 7000 Series firewalls and is not officially supported for bandwidth monitoring.
Due to architectural design of the Palo Alto Networks 7000 platforms (7050 and 7080), the information in this article is not applicable and will not report accurate global throughput of the device.
For all other available platform models supporting QoS, this configuration will return global throughput data.
We are evaluating possible code updates to correct this in a future software version as of this time.
Overview
Firewall monitoring protocols, such as NetFlow or SNMP, and applications, such as Pan(w)chrome, can be used to view traffic passing through an interface on the Palo Alto Networks firewall. Implementing tools like ntop or nfsen for Netflow, or MRTG or Cacti for SNMP require extra effort to deploy. Additionally, if the NetFlow collector is not application-aware, it may not be able to drill down and graphically represent traffic by application.
Graphical visualization of traffic can be useful when trying to determine a cause for network saturation, or measuring network throughput using tools like iperf. There is an embedded graphing tool in PAN-OS that helps visualize the amount of traffic passing through an interface.
This document describes how to use the graphing tool in PAN-OS and leverage QoS classes to help group the graphing by applications.
Note: This will actually not apply to QoS on that traffic. However, if QoS is desired, see page 345 of PAN-OS Administrator's Guide 6.0 (English).
Steps
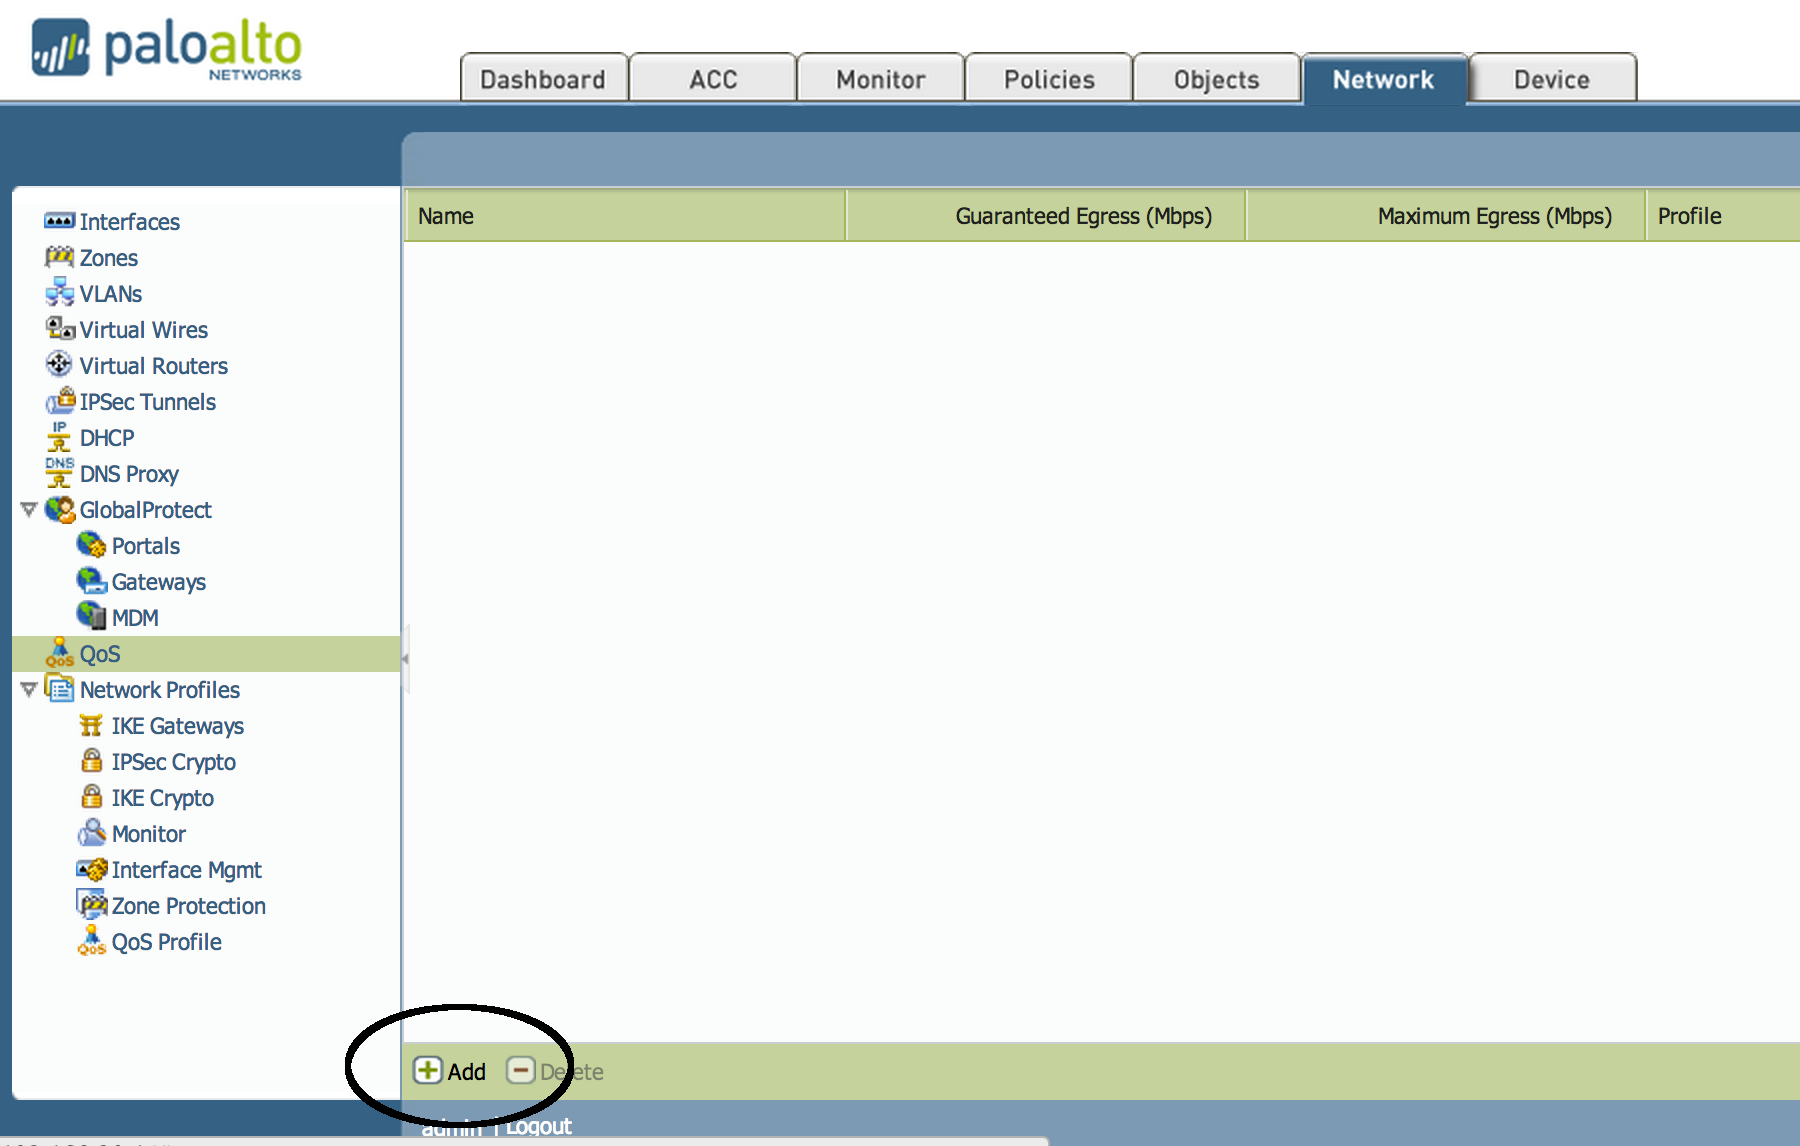
- From the WebGUI go to Network > QoS and click Add:
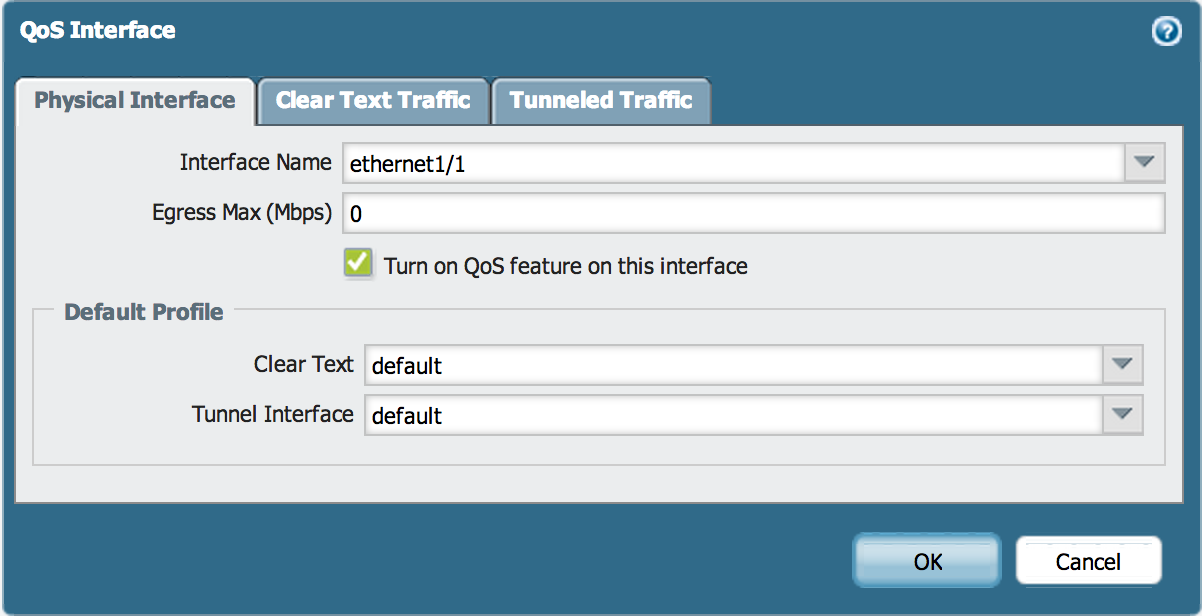
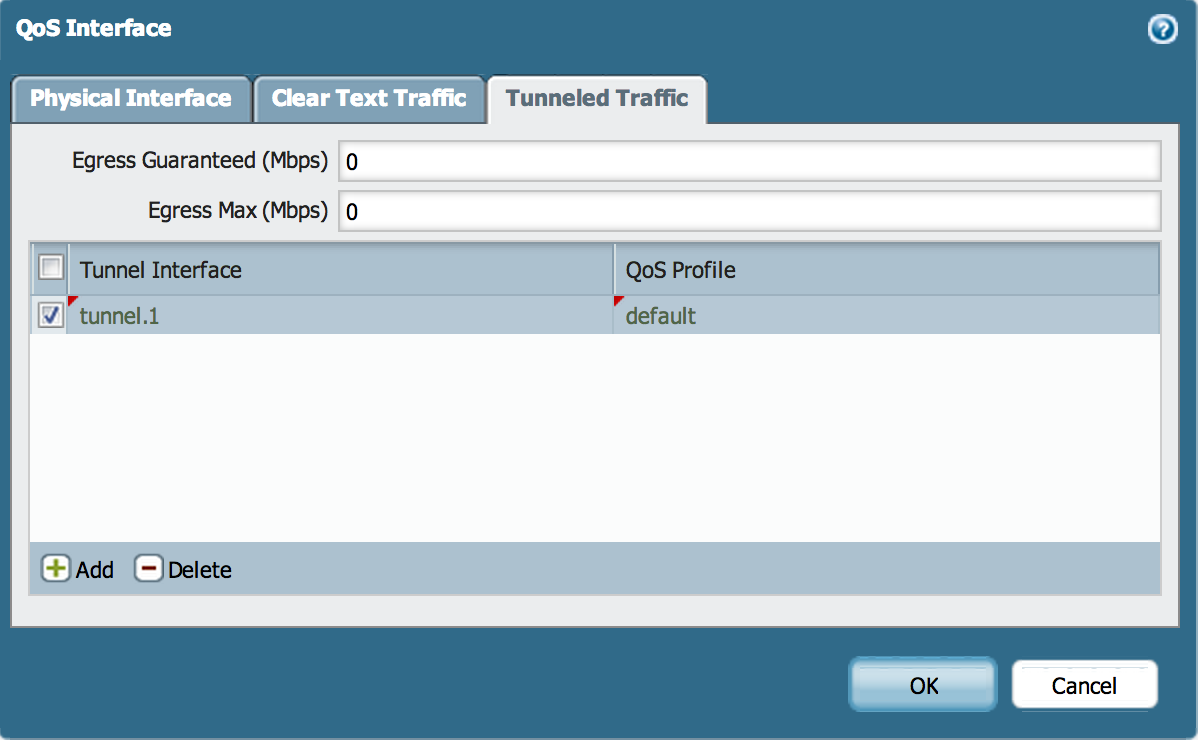
- Populate the information, and choose the interface to monitor. The traffic represented in the graph will be what is egressing the interface. If selecting an untrusted interface that is facing the ISP, it will be representing the 'Upload' traffic. This interface may be associated with IPSec tunnels. If IPSec tunnels are present, populate the information for the tunnel interfaces in the 'Tunneled Traffic' tab.
Note: Since this will help visualize traffic egressing the interface, to visualize traffic for 'Download' add a QoS Interface for each interface facing the internal network.
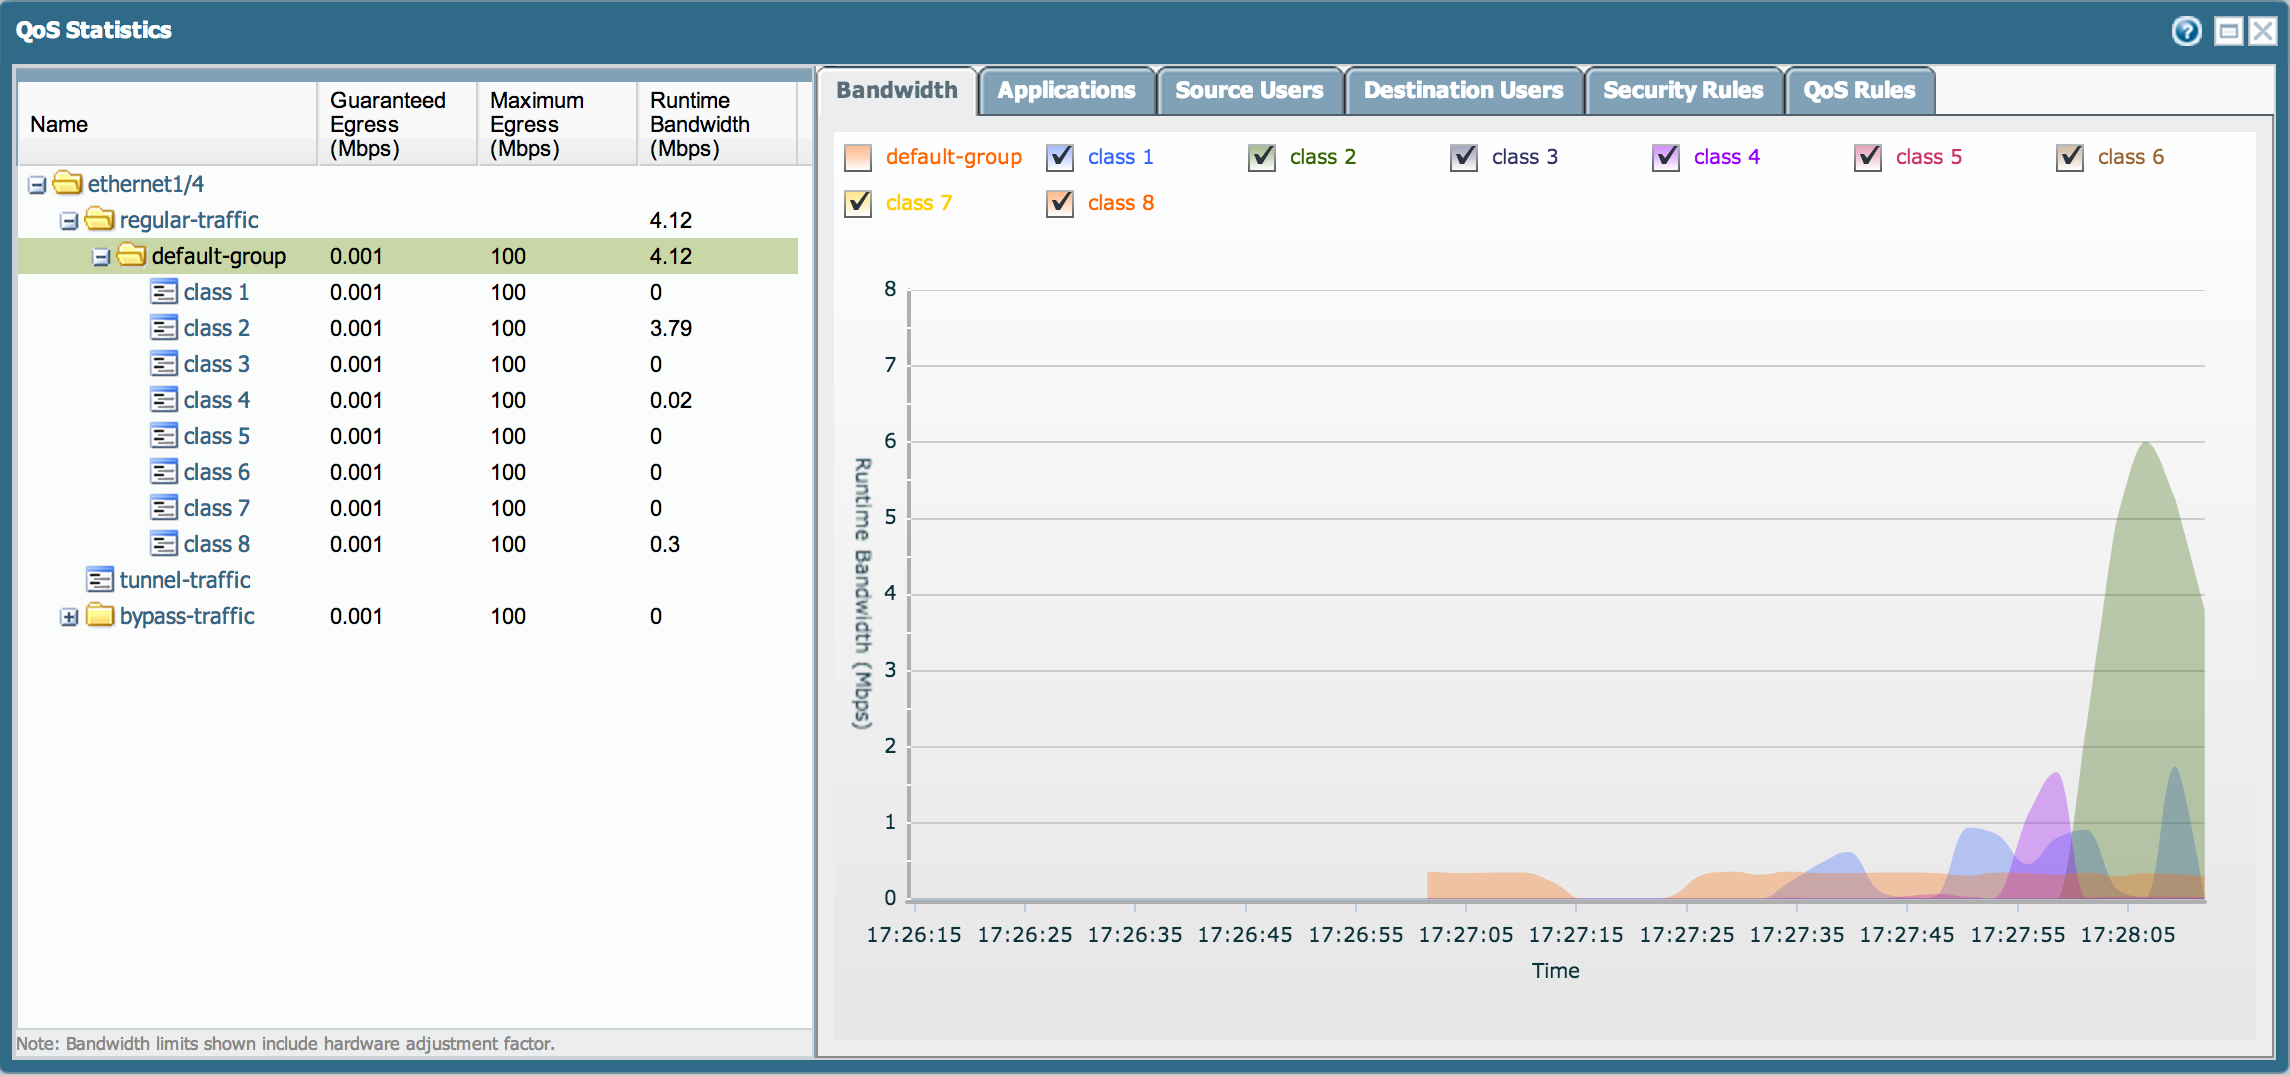
- Commit changes, and select "Statistics" on the right:
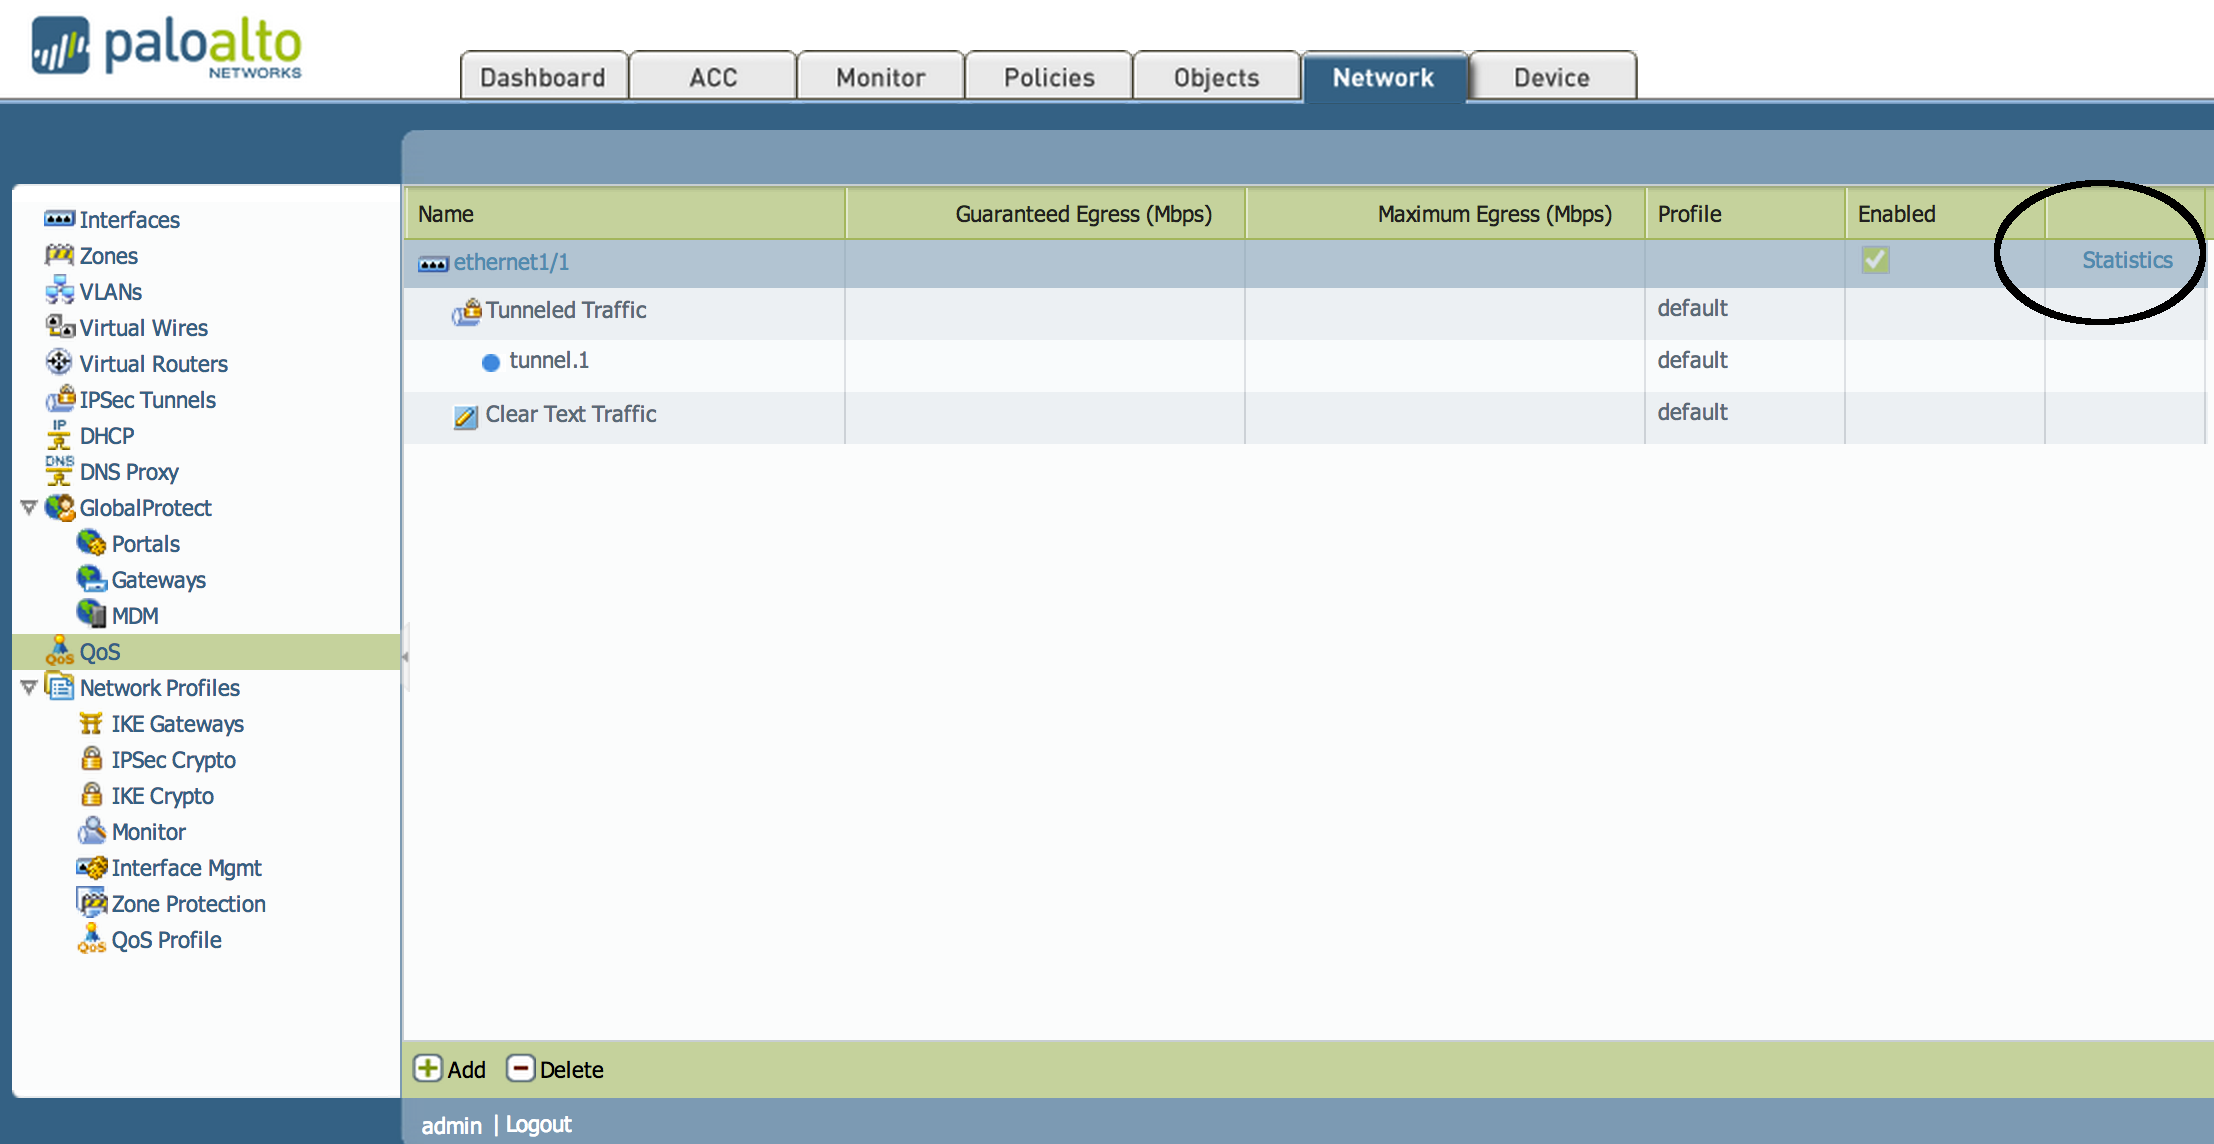
The following example shows a graphic of current 'Upload' traffic, or traffic egressing the selected interface:
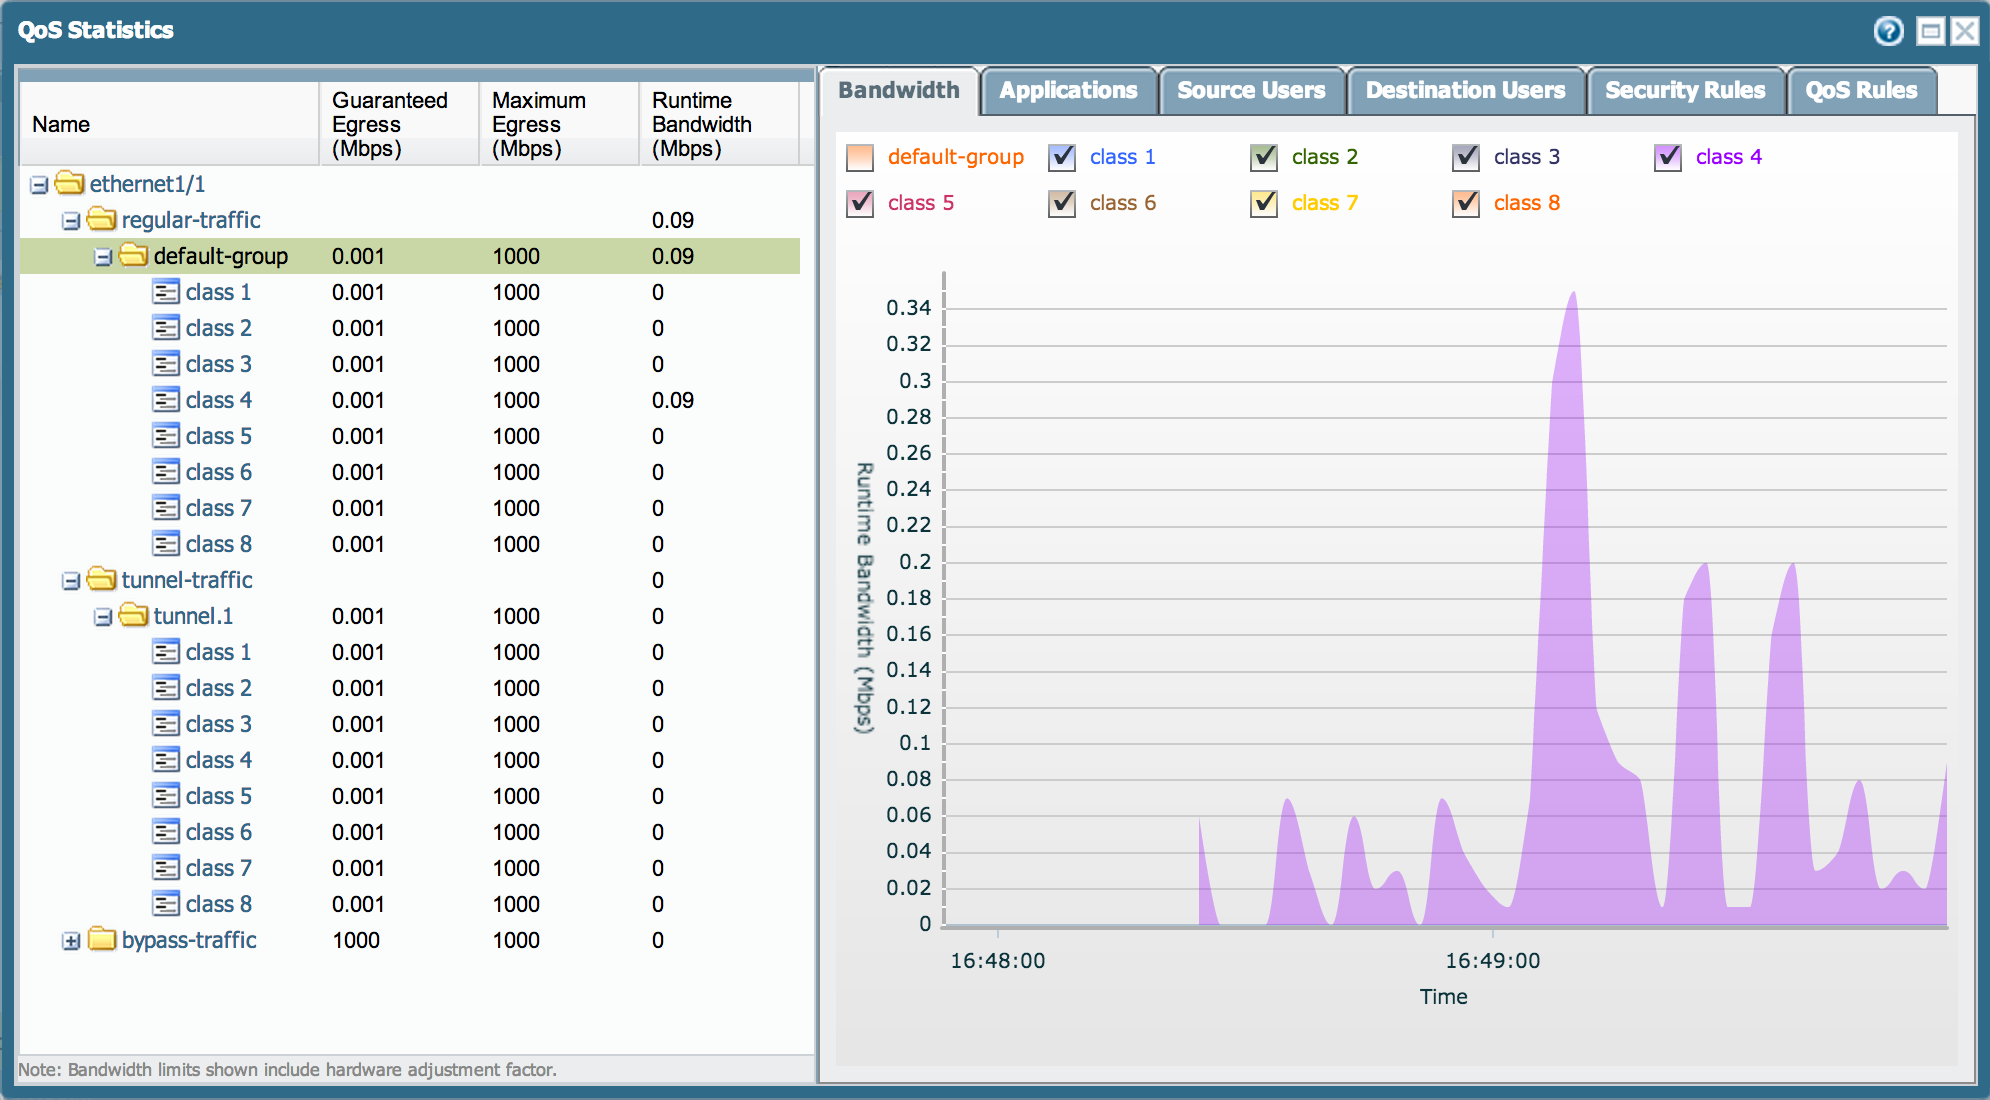
Note: All traffic will be classified, by default, as 'class 4.'
Matching Applications to QoS Class
A specific application or groups of applications can also be defined on a QoS Policy, which matches them to a specific class. This helps quantify and visualize specific types of traffic egressing the interface.
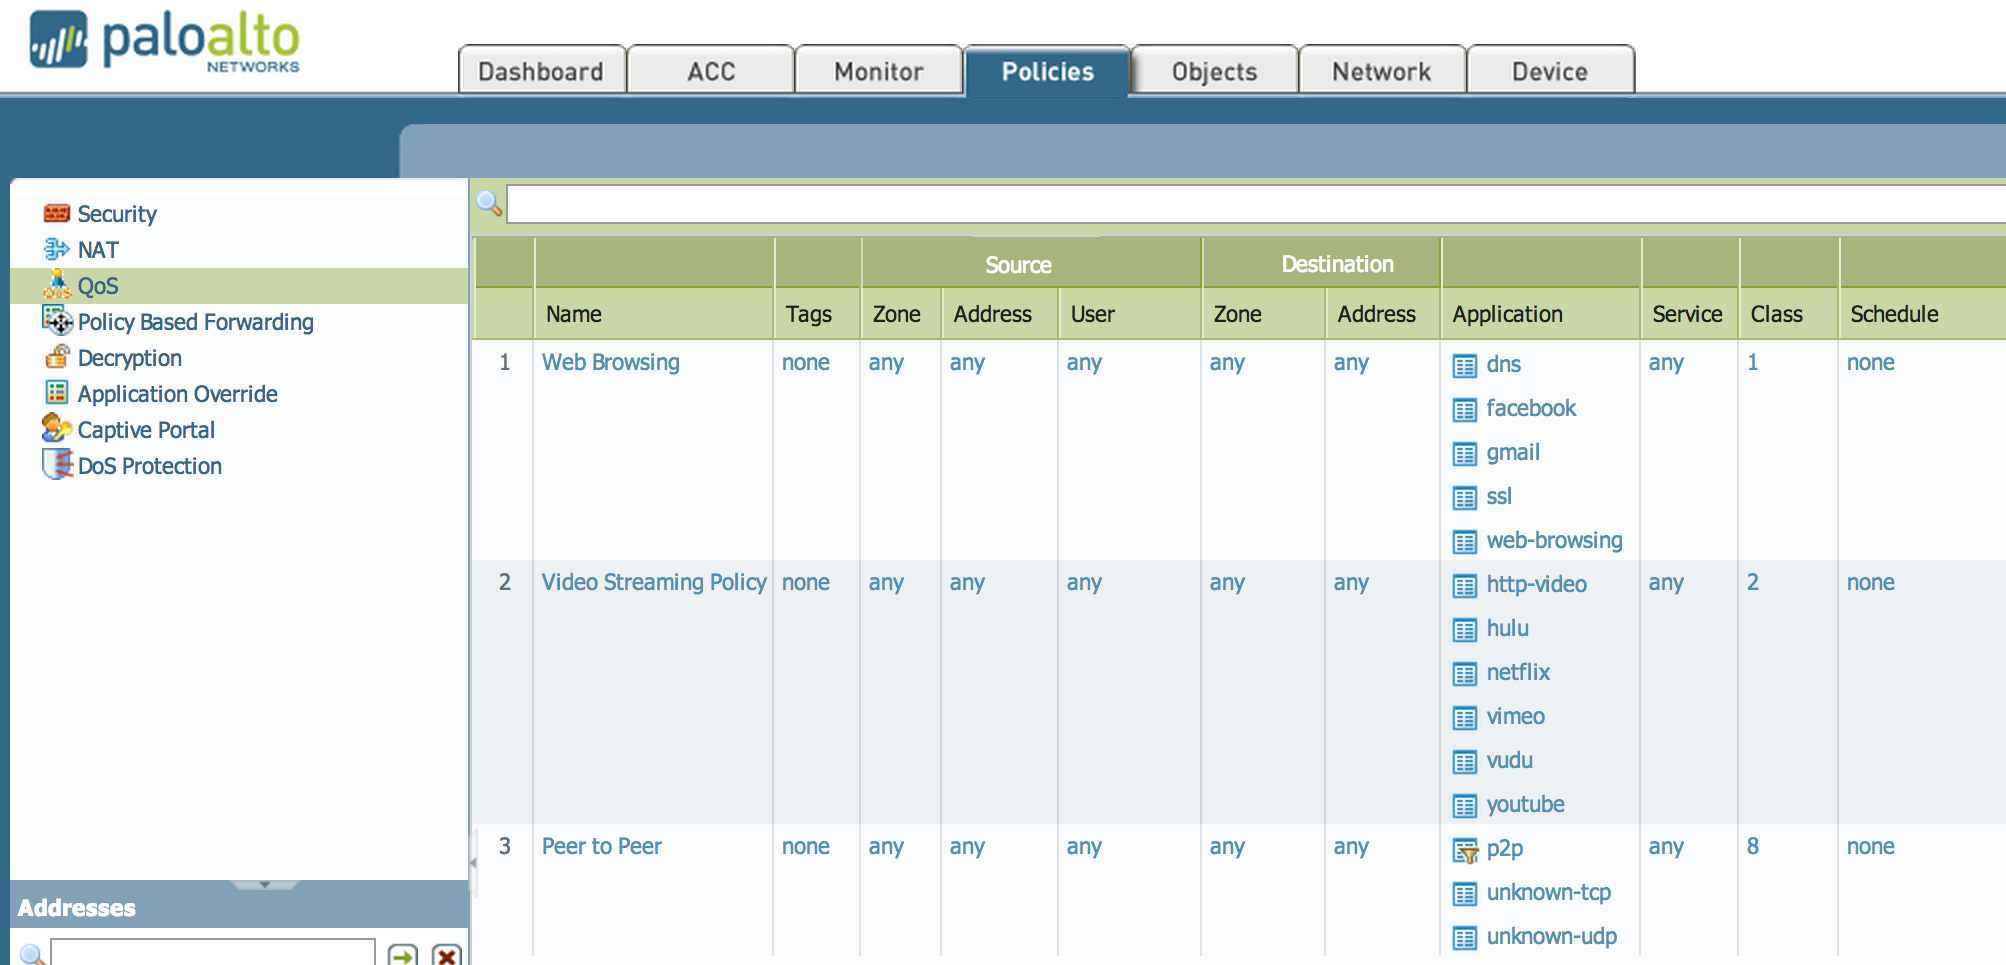
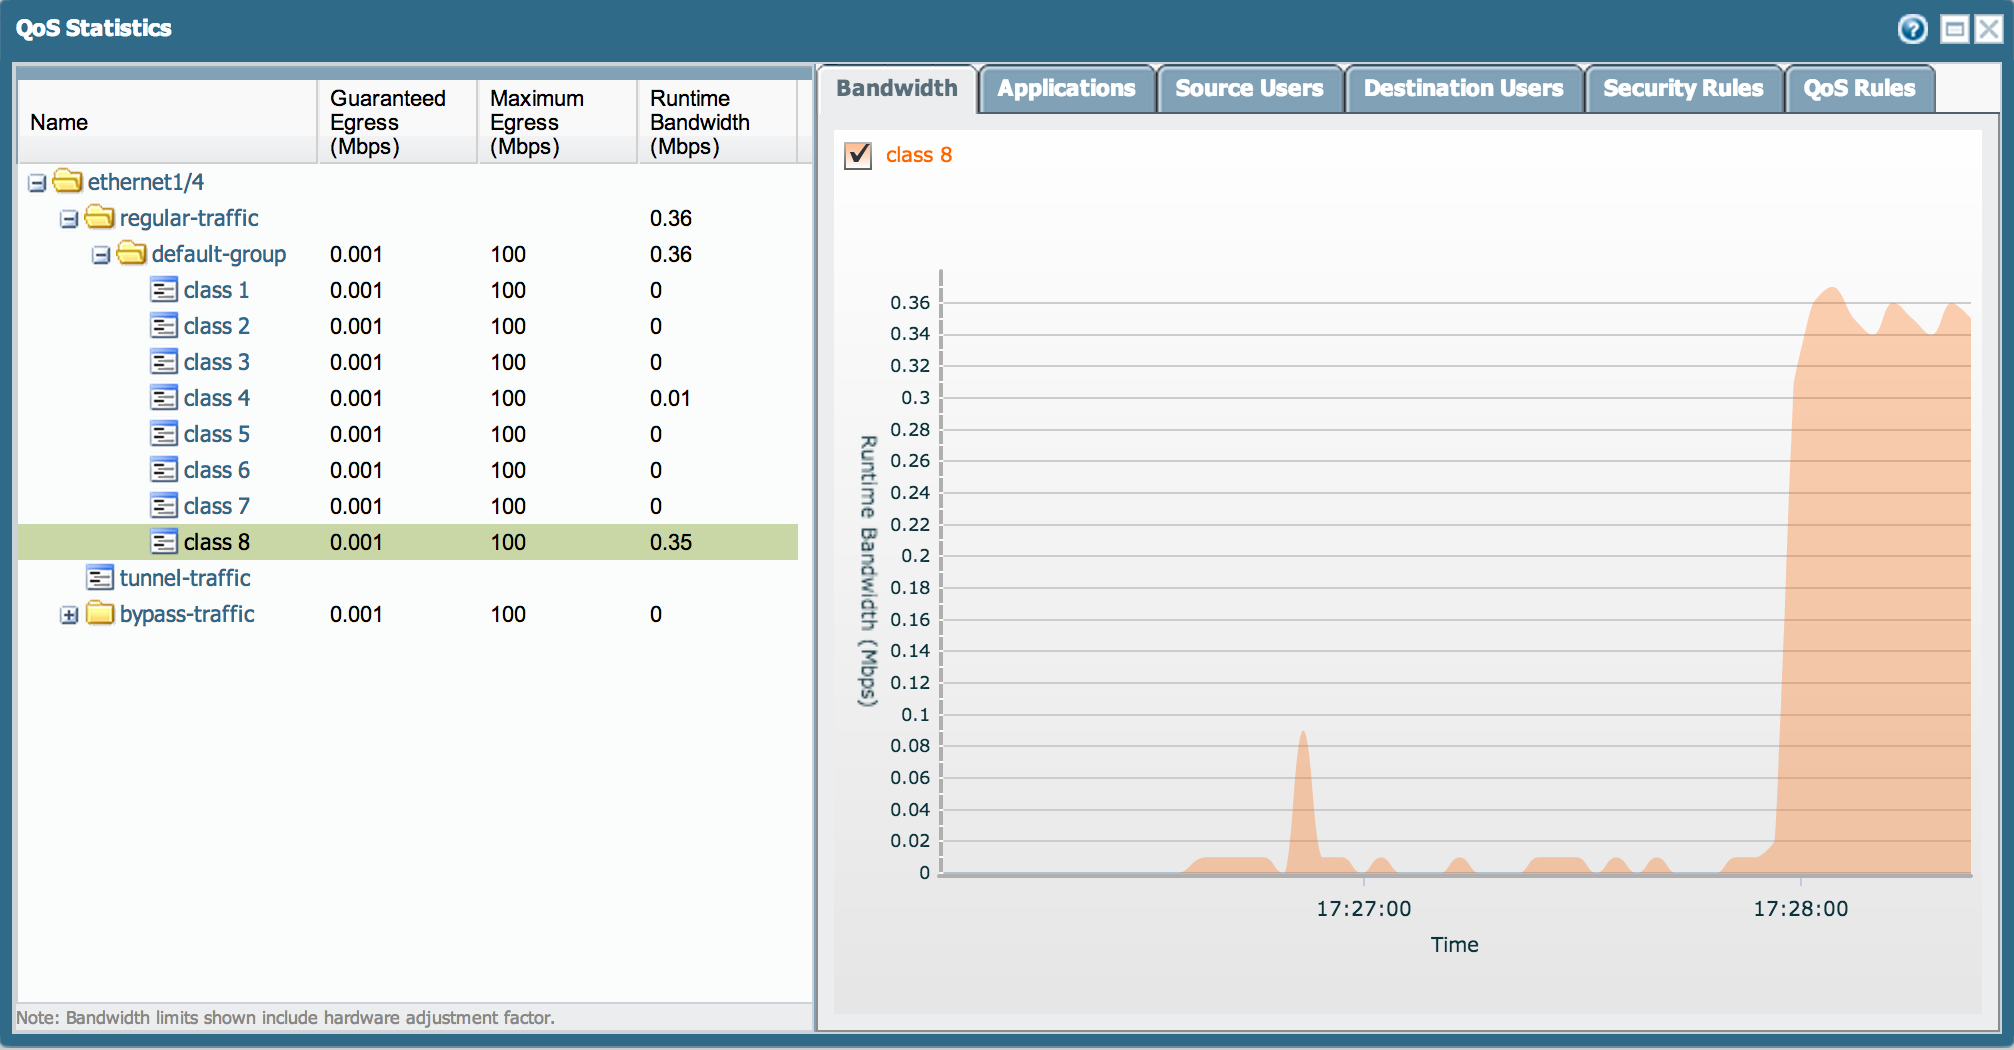
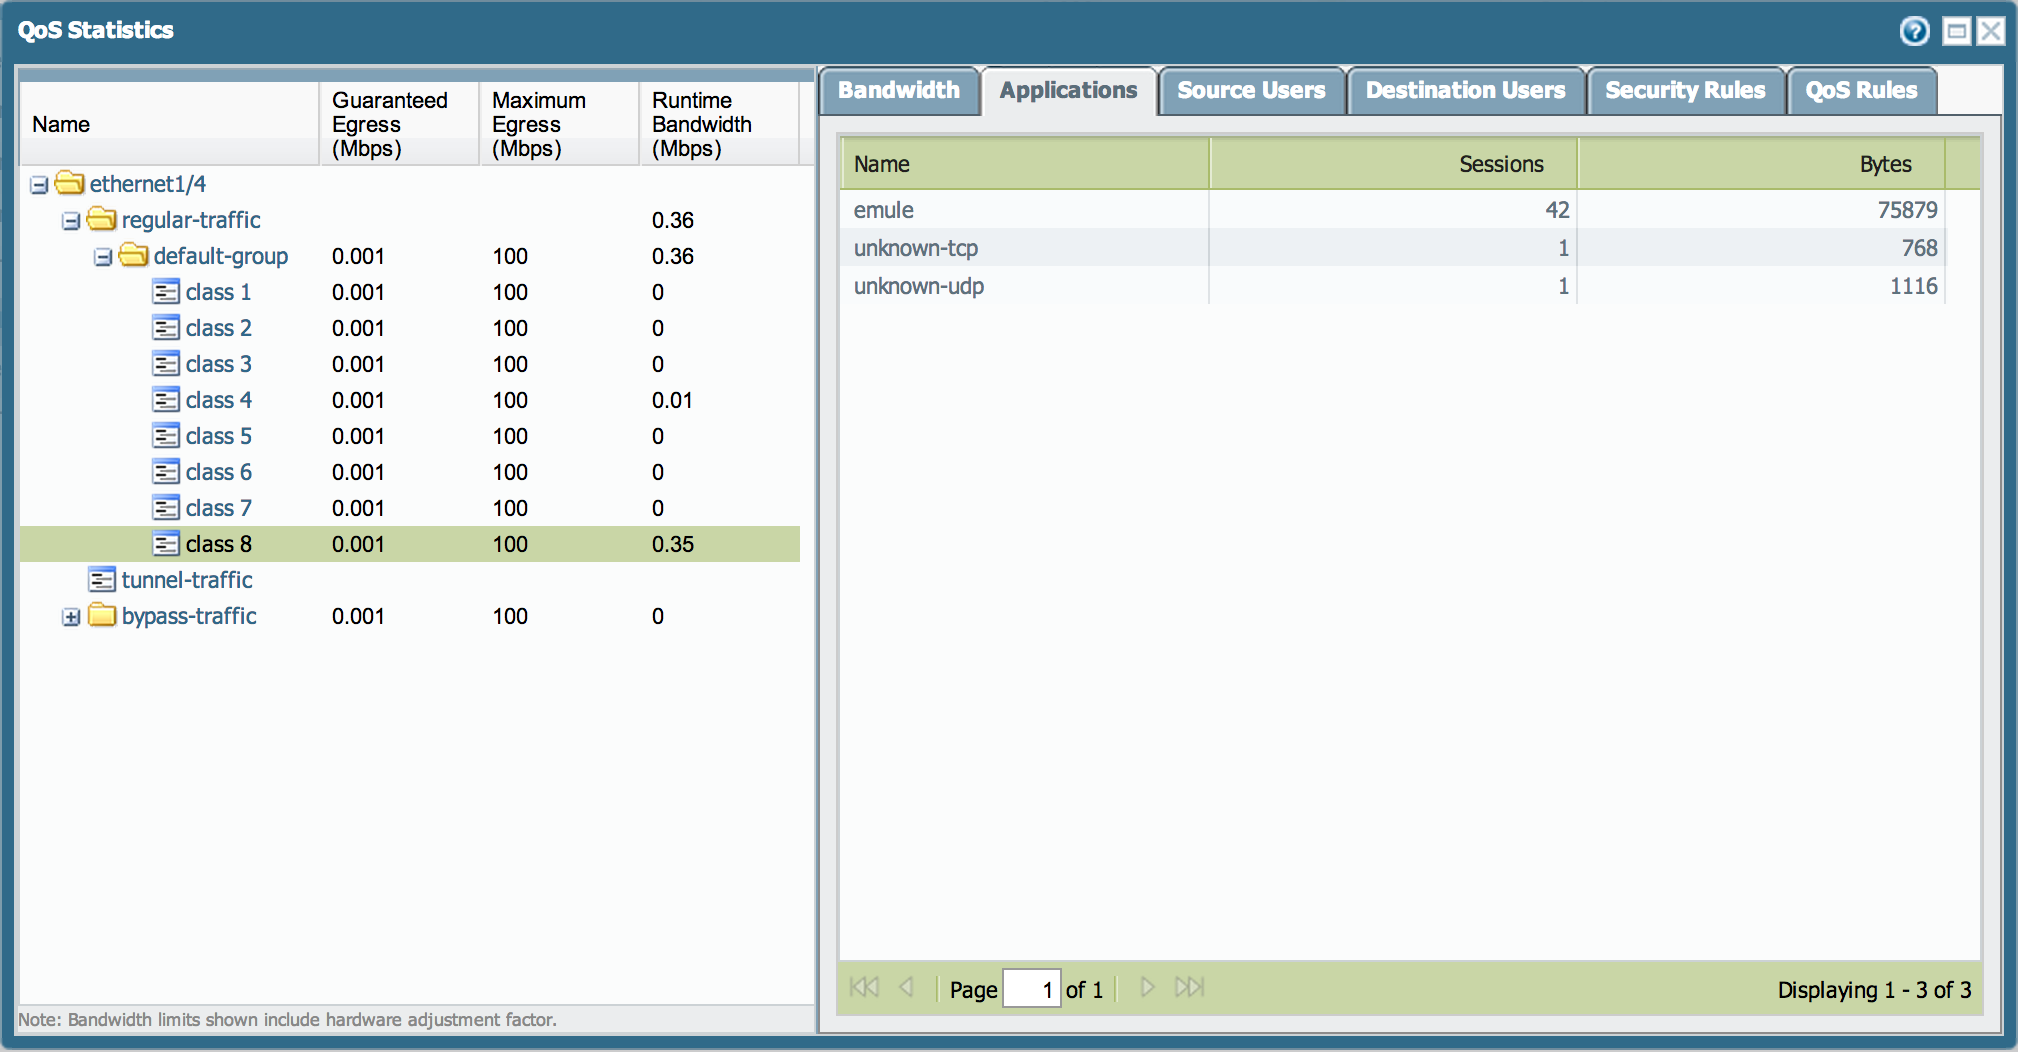
The following screenshot displays how Peer-to-Peer traffic on Class 8 is observed.
Follow the steps below to display Peer-to-Peer traffic:
- Go to the Applications tab to see which applications are running on the interface.
- Select the default-group to view a mix-and-match graphic per class.
Defining a Behavior for QoS Classes
QoS Profiles can be modified to define a behavior for each QoS class. For further details, refer to Page 338 of 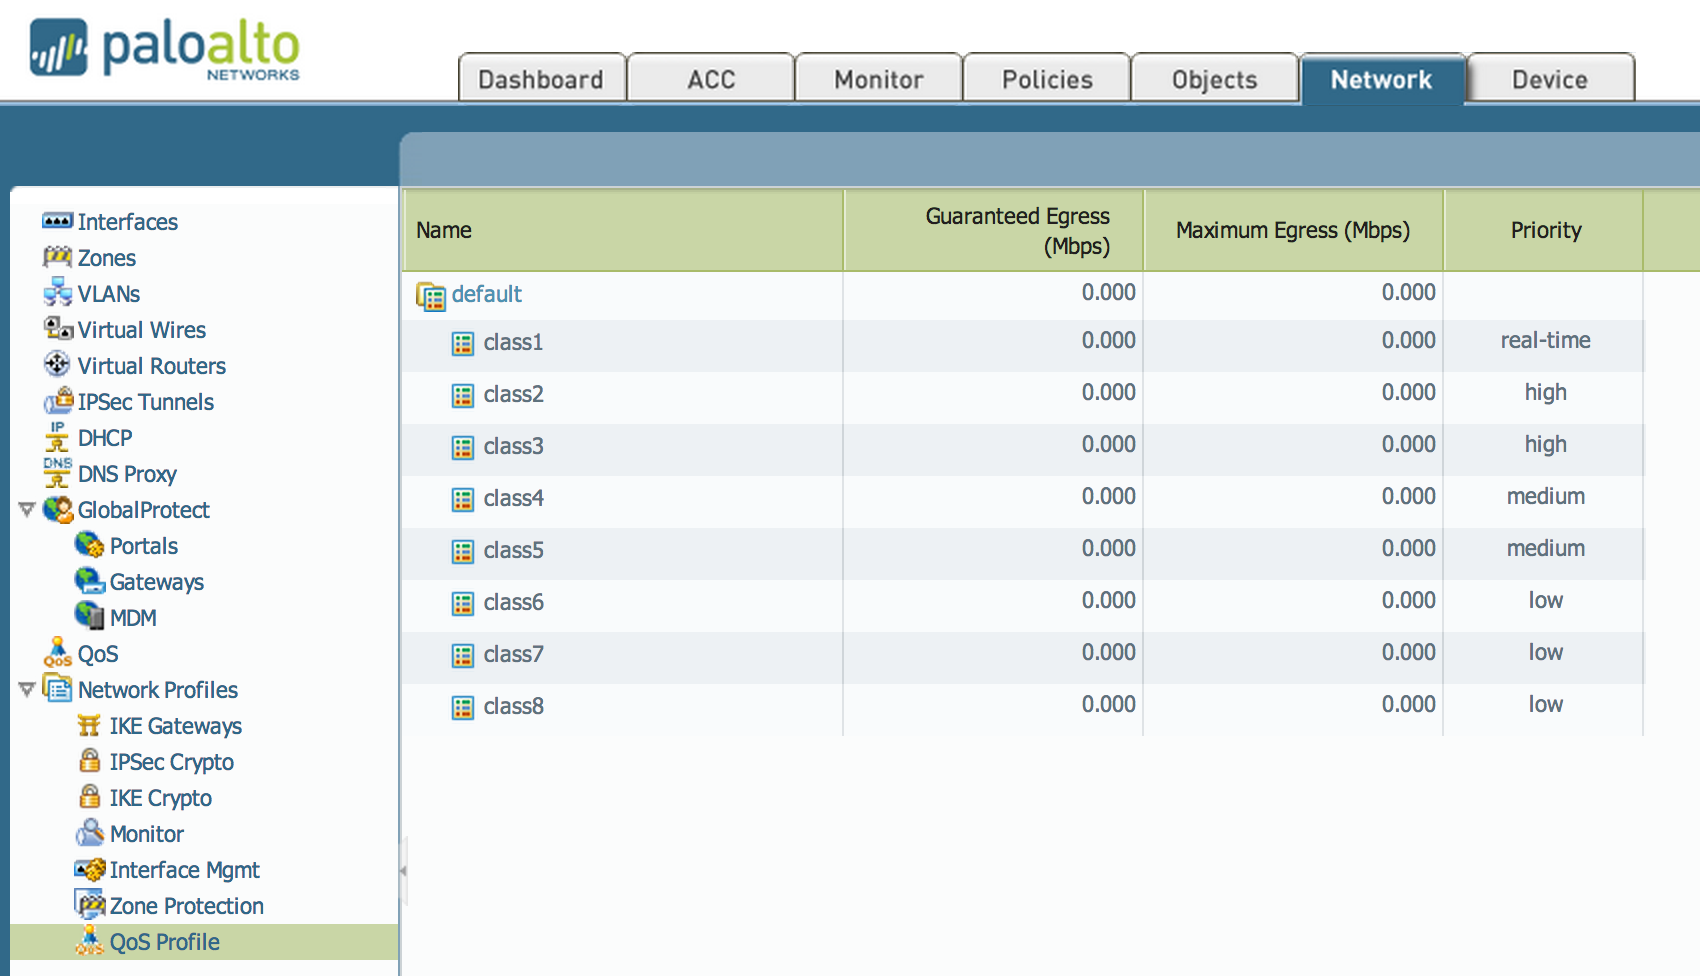
Note: To visualize more than one graphic simultaneously, open a separate browser tab or window.
owner: mivaldi