The first place to go is the Packet Capture menu on the GUI, where you can manage filters, add capture stages, and easily download captures.
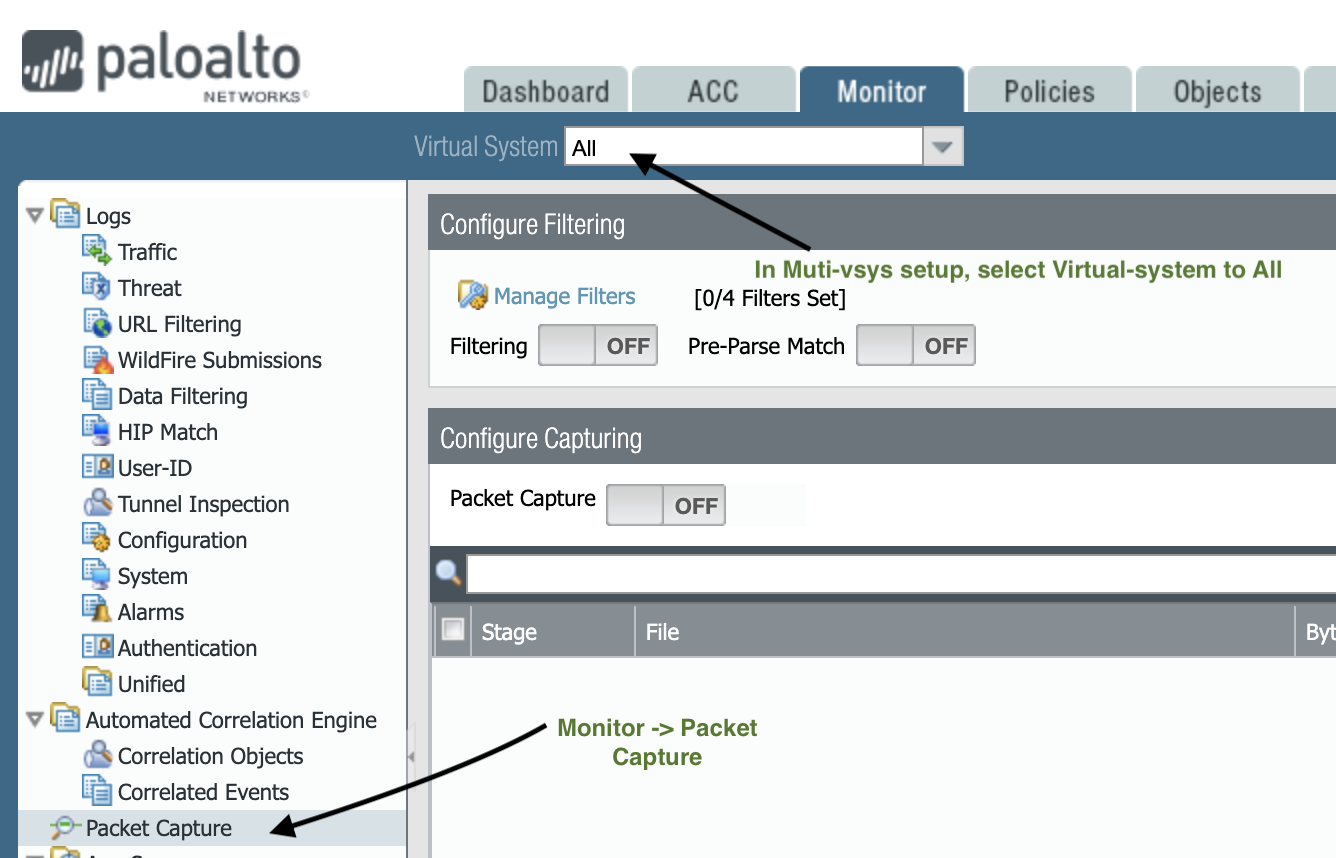
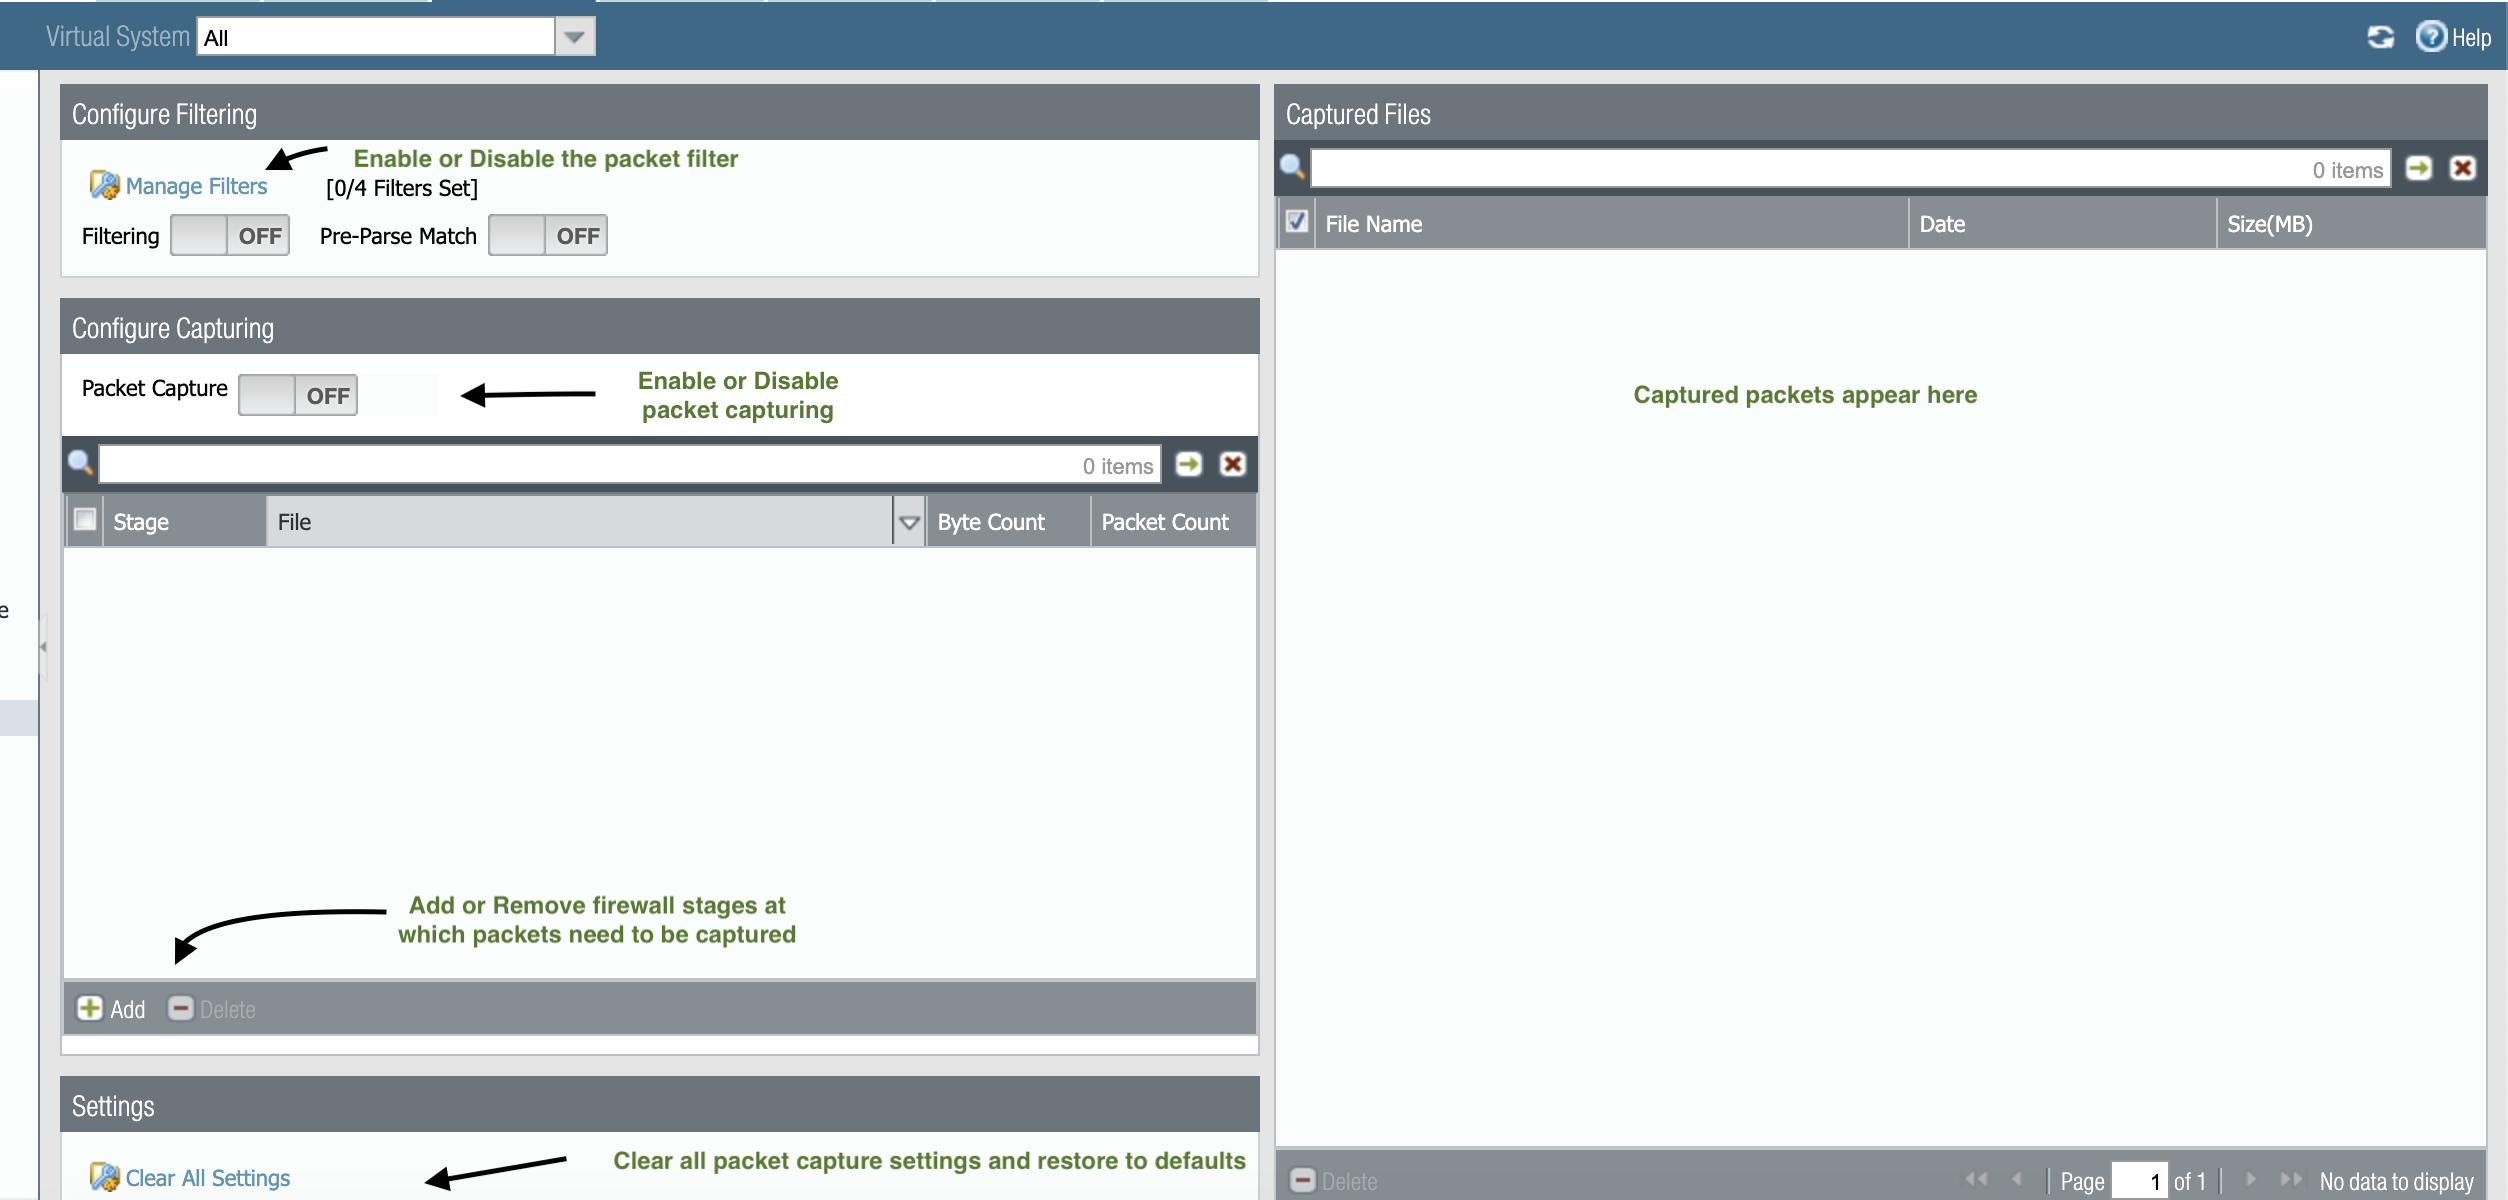
Before we get started, there are a few things you should know:
- Four packet filters can be added with a variety of attributes.
- Packet captures are session-based, so a single filter is capable of capturing both client2server and server2client.
- Packets are captured on the dataplane vs on the interface (this explains the next bullet).
- Pre-Parse Match is a feature that can capture all files before they are processed by the engines running on the dataplane, which can help troubleshoot issues where an engine may not be properly accepting an inbound packet. This option should be used only if instructed by the support and on a low volume time of day as it will capture everything.
- When filtering is enabled, new sessions are marked for filtering and can be captured, but existing sessions are not being filtered and may need to be restarted to be able to capture them.
- Offloaded sessions can't be captured so offloading may need to be disabled temporarily. An offloaded session will display 'layer7 processing: completed' in the show session details. Note that this may cause performance impact due to the matching packets being handled by the CPU. Run this during a maintenance window and take the help of Support if required.
It's a lot to remember, but it will all make sense after you've tried your hand at a couple of packet captures of various protocols, I promise!
- Let's add a couple of packet filters:

Filters 1 and 3 are my actual filters: I want to check connections from my client at IP 192.168.0.34 making HTTP connections on port 80 TCP to 198.51.100.97 and SSH connections on port 22 TCP to 198.51.100.1
Filters 2 and 4 are my 'backup' filters: I mentioned earlier that packet capture is session aware, but just in case something happens to the returning packet upstream that causes it to fail to match my NAT rule (maybe an upstream device mangles the source port or does something odd to the sequence number), I usually set a returning rule to catch any stray packets that would get dropped due to their not matching.
Note: Ensure the filter is as precise as possible. Never run filters matching the entire subnets such as 192.168.0.0/16 or 0.0.0.0/0 as this may cause performance impact and outage.
If we now switch the Filtering button to ON, the filters will be applied to any new sessions that match the criteria:

- A simple way to check if the filter is working is to check if global counters are increasing if a new session is initiated.
From the CLI, I execute this command:
> show counter global filter delta yes packet-filter yes

Global counters:
Elapsed time since last sampling: 2.647 seconds

--------------------------------------------------------------------------------
Total counters shown: 0
--------------------------------------------------------------------------------
And no counters are displayed.
- 'delta yes' indicates I want to view counters that have incremented since the last time I executed this command.
- 'packet-filter yes' indicates I want to see only global counters that match my filters.
If I now refresh my browser and execute the command again:
> show counter global filter packet-filter yes delta yes

Global counters:
Elapsed time since last sampling: 2.630 seconds

name value rate severity category aspect description
--------------------------------------------------------------------------------
pkt_sent                     22 8 info packet pktproc Packets transmitted
pkt_outstanding              22 8 info packet pktproc Outstanding packet to be transmitted
session_allocated            4  1 info session resource Sessions allocated
session_installed            4  1 info session resource Sessions installed
appid_proc                   2  0 info appid pktproc The number of packets processed by Application identification
appid_use_dfa_1              2  0 info appid pktproc The number of packets using the second DFA table
nat_dynamic_port_xlat        4  1 info nat resource The total number of dynamic_ip_port NAT translate called
dfa_sw                       8  3 info dfa pktproc The total number of dfa match using software
ctd_sml_opcode_set_file_type 1  0 info ctd pktproc sml opcode set file type
aho_sw                       5  1 info aho pktproc The total usage of software for AHO
ctd_pkt_slowpath             4  1 info ctd pktproc Packets processed by slowpath
--------------------------------------------------------------------------------
Total counters shown: 11
--------------------------------------------------------------------------------
You'll see that there are a bunch of counters. I've added a link to some more information about global counters at the bottom of this article, and we'll be covering them more in a future episode. But for now, as long as there are counters, we should be good to go.
- Next you're going to configure the stages—there are 4:
- drop stage is where packets get discarded. The reasons may vary and, for this part, the global counters may help identify if the drop was due to a policy deny, a detected threat, or something else.
- receive stage captures the packets as they ingress the firewall before they go into the firewall engine. When NAT is configured, these packets will be pre-NAT.
- transmit stage captures packets how they egress out of the firewall engine. If NAT is configured, these will be post-NAT.
- firewall stage captures packets in the firewall stage.
For every stage, you can assign a name for the output file and set a maximum packet or byte count:

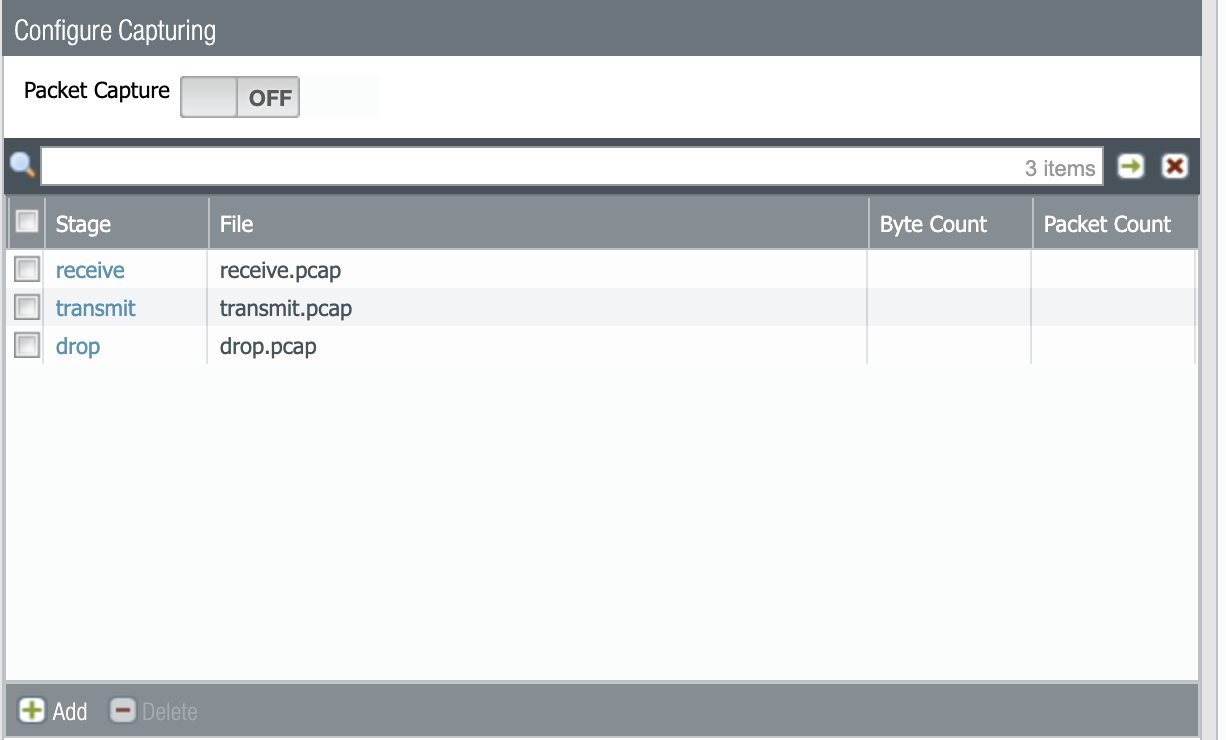
- When all the desired stages are set, you can switch the capture button to ON, or you can use the CLI, clear the existing sessions which match the filters specified. This is to make sure no session has been active since before the filters were enabled. Then use the capture on command to start the capture as displayed below.
> show session all        => Note down the session number matching the configured filters.
> clear session id <id#>  => This is to clear any existing session that matches the filters configured.

Example:
 > show session all
--------------------------------------------------------------------------------
ID          Application    State   Type Flag  Src[Sport]/Zone/Proto (translated IP[Port])
Vsys                                          Dst[Dport]/Zone (translated IP[Port])
--------------------------------------------------------------------------------
27240        web-browsing   ACTIVE  FLOW  NS   192.168.0.34[61003]/trust/6  (198.51.100.230[31047])
vsys1                                          198.51.100.97[80]/ISP1  (198.51.100.97[80])
....(output omitted)....

> clear session id 27240
session 27240 cleared

> debug dataplane packet-diag set capture on

Packet capture is enabled
You can now launch the sessions you'd like to capture. To verify if the session has started, use the show session command:
> show session all

--------------------------------------------------------------------------------
ID          Application    State   Type Flag  Src[Sport]/Zone/Proto (translated IP[Port])
Vsys                                          Dst[Dport]/Zone (translated IP[Port])
--------------------------------------------------------------------------------
32637        web-browsing   ACTIVE  FLOW  NS   192.168.0.34[61903]/trust/6  (198.51.100.230[31547])
vsys1                                          198.51.100.97[80]/ISP1  (198.51.100.97[80])
32635        ssh            ACTIVE  FLOW  NS   192.168.0.34[61901]/trust/6  (198.51.100.230[52812])
vsys1                                          198.51.100.1[22]/ISP1  (198.51.100.1[22])
When you're done, the capture can be turned off by toggling the button back to the OFF position or using the debug command:
> debug dataplane packet-diag set capture off
Packet capture is disabled

> debug dataplane packet-diag clear filter-marked-session all
Unmark All sessions in packet debug
Note: Do not forget to turn off the packet capture after debugging. Failing to do so may tax the CPU and can cause performance problems.
There will now be captured files available for download which you can analyze with Wireshark:
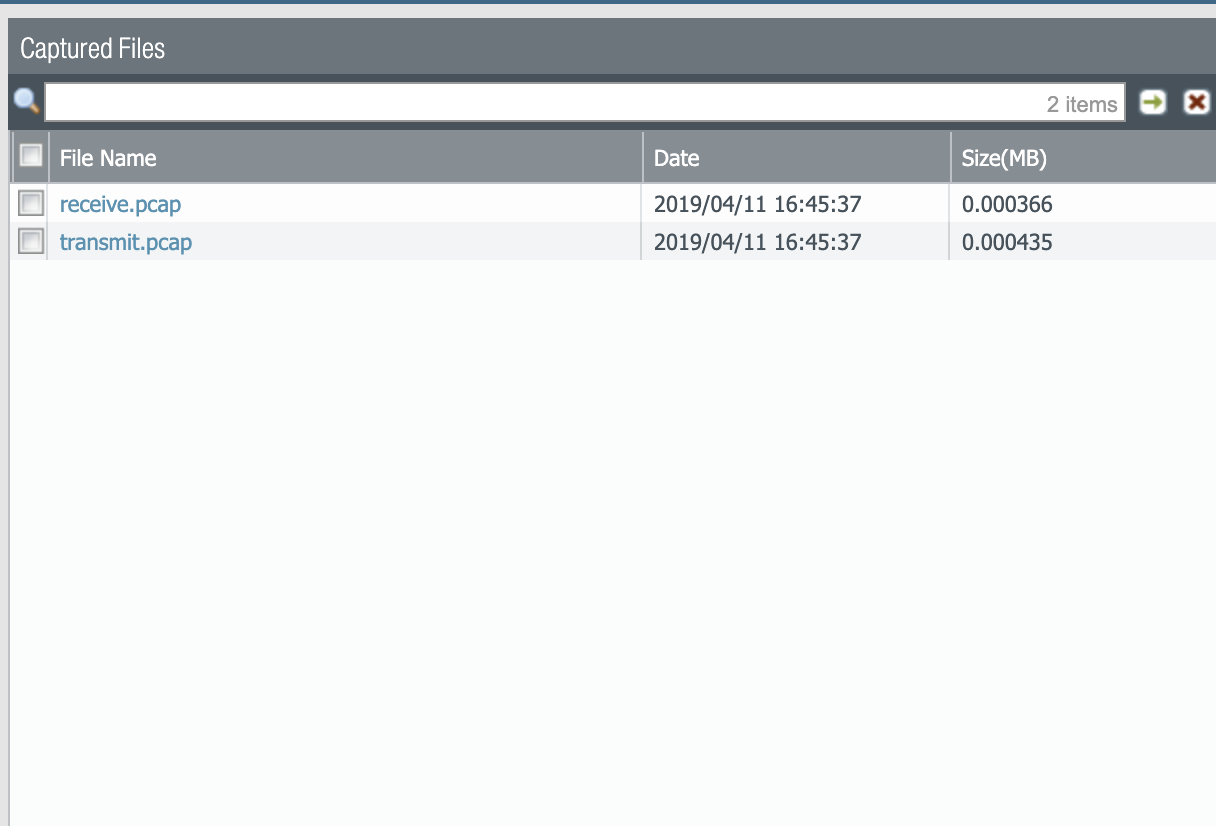
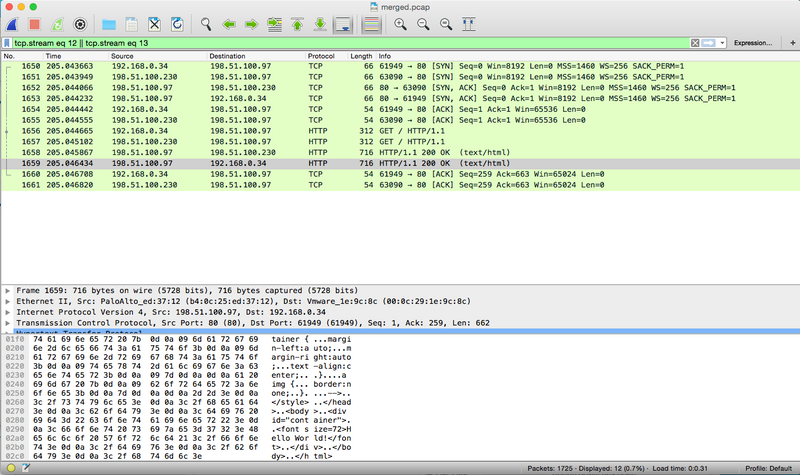
After you download the packet captures, you may need to merge the transmit and receive files together:
- The receive stage will have the client's private IP to the web server public IP, and the returning packet from the web server public IP to the firewall external IP (receive stage is pre-NAT).
- The transmit stage will have the firewall external IP (client NAT) to the server public IP, and the returning public IP to the client private IP.
As that may be a little confusing when you're trying to follow the TCP stream, you'll want to take note of this important difference between those two files.


These two stages will ensure you are able to verify if NAT is being applied properly. You can also see if there is any difference between the packets sent out and received from both the client and server perspectives.
The merged result should look something like this and allows you to compare packet-per-packet what is being sent out and what is being received.
A couple of useful articles to help you better understand how packets flow through the system:
What is the Significance of Global Counters?
Packet Flow Sequence in PAN-OS
Management plane
To Troubleshoot connectivity issues with the management plane, the built-in tcpdump command can be used to capture useful information:
admin@myNGFW> tcpdump filter "port 53"
Press Ctrl-C to stop capturing

tcpdump: listening on eth0, link-type EN10MB (Ethernet), capture size 96 bytes
^C
16 packets captured
32 packets received by filter
0 packets dropped by kernel
The resulting output is stored in a mgmt.pcap file on the management plane:

admin@myNGFW> view-pcap mgmt-pcap mgmt.pcap
15:24:07.512889 IP 10.0.0.1.36606 > 10.0.0.98.domain:  49243+ PTR? 0.0.0.10.in-addr.arpa. (41)
15:24:07.513106 IP 10.0.0.98.domain > 10.0.0.1.36606:  49243 NXDomain 0/1/0 (100)
15:24:17.196515 IP 10.0.0.1.45455 > 10.0.0.98.domain:  3126+ PTR? 0.0.0.10.in-addr.arpa. (41)
15:24:17.196762 IP 10.0.0.98.domain > 10.0.0.1.45455:  3126 NXDomain 0/1/0 (100)
15:24:31.126186 IP 10.0.0.1.57230 > 10.0.0.98.domain:  2978+ A? panos.wildfire.paloaltonetworks.com. (53)
15:24:31.126196 IP 10.0.0.1.57230 > 10.0.0.98.domain:  55173+ AAAA? panos.wildfire.paloaltonetworks.com. (53)
15:24:31.161436 IP 10.0.0.98.domain > 10.0.0.1.57230:  2978 4/0/0[|domain]
15:24:31.194586 IP 10.0.0.98.domain > 10.0.0.1.57230:  55173 2/0/0[|domain]
15:25:56.746679 IP 10.0.0.1.46048 > 10.0.0.98.domain:  43532+ A? wildfire.paloaltonetworks.com. (47)
15:25:56.746689 IP 10.0.0.1.46048 > 10.0.0.98.domain:  16653+ AAAA? wildfire.paloaltonetworks.com. (47)
15:25:56.794940 IP 10.0.0.98.domain > 10.0.0.1.46048:  43532 1/0/0 (63)
15:25:56.795553 IP 10.0.0.98.domain > 10.0.0.1.46048:  16653 0/1/0 (131)
15:25:59.038459 IP 10.0.0.1.51804 > 10.0.0.98.domain:  23806+ A? panos.wildfire.paloaltonetworks.com. (53)
15:25:59.038471 IP 10.0.0.1.51804 > 10.0.0.98.domain:  31471+ AAAA? panos.wildfire.paloaltonetworks.com. (53)
15:25:59.071431 IP 10.0.0.98.domain > 10.0.0.1.51804:  23806 4/0/0[|domain]
15:25:59.113552 IP 10.0.0.98.domain > 10.0.0.1.51804:  31471 2/0/0[|domain]
Please check out this article for additional information How To Packet Capture (tcpdump) On Management Interface